


Configure Alert Settings
- Open an alert, then click the 'Alert Settings' tab.
This is where an alert's behaviour is set: how often it may repeat, whether it shows in the portal, whether it opens a service desk ticket, and how much of the device's data goes into that ticket.
You can suppress repeat alerts, raise portal notifications, open and close tickets automatically, choose the department and priority those tickets use, and add device and performance data to them.
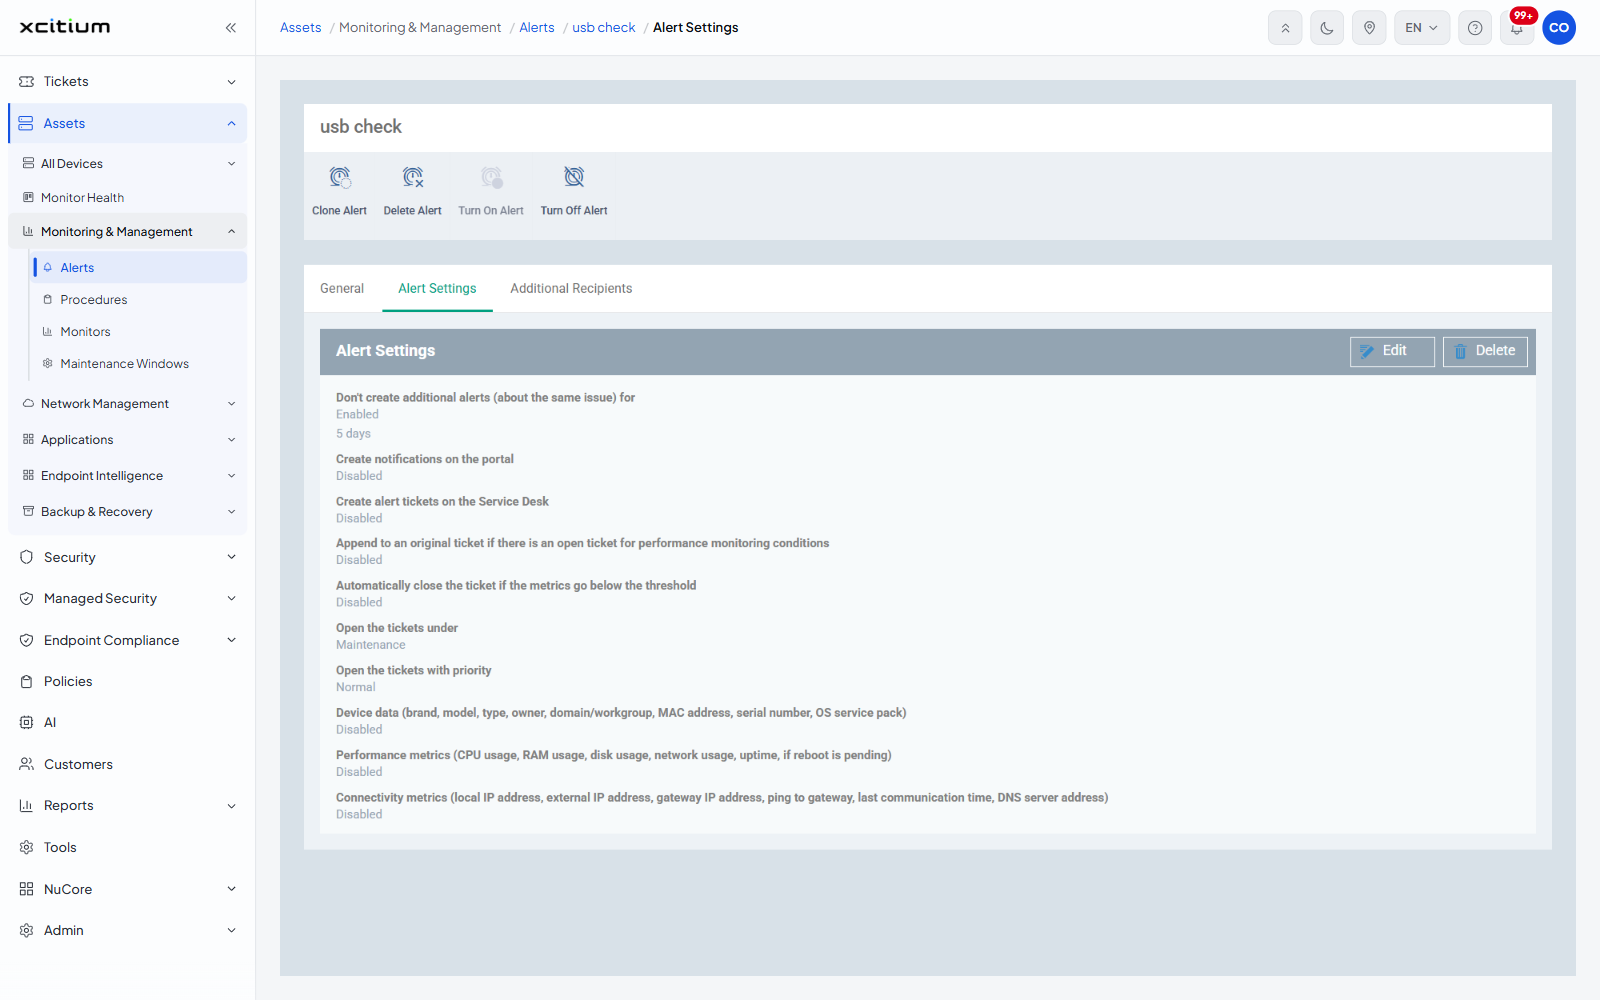
Reading the tab
The read view lists each setting with 'Enabled' or 'Disabled' beneath it, and the chosen value where one applies. Click 'Edit' to change them.
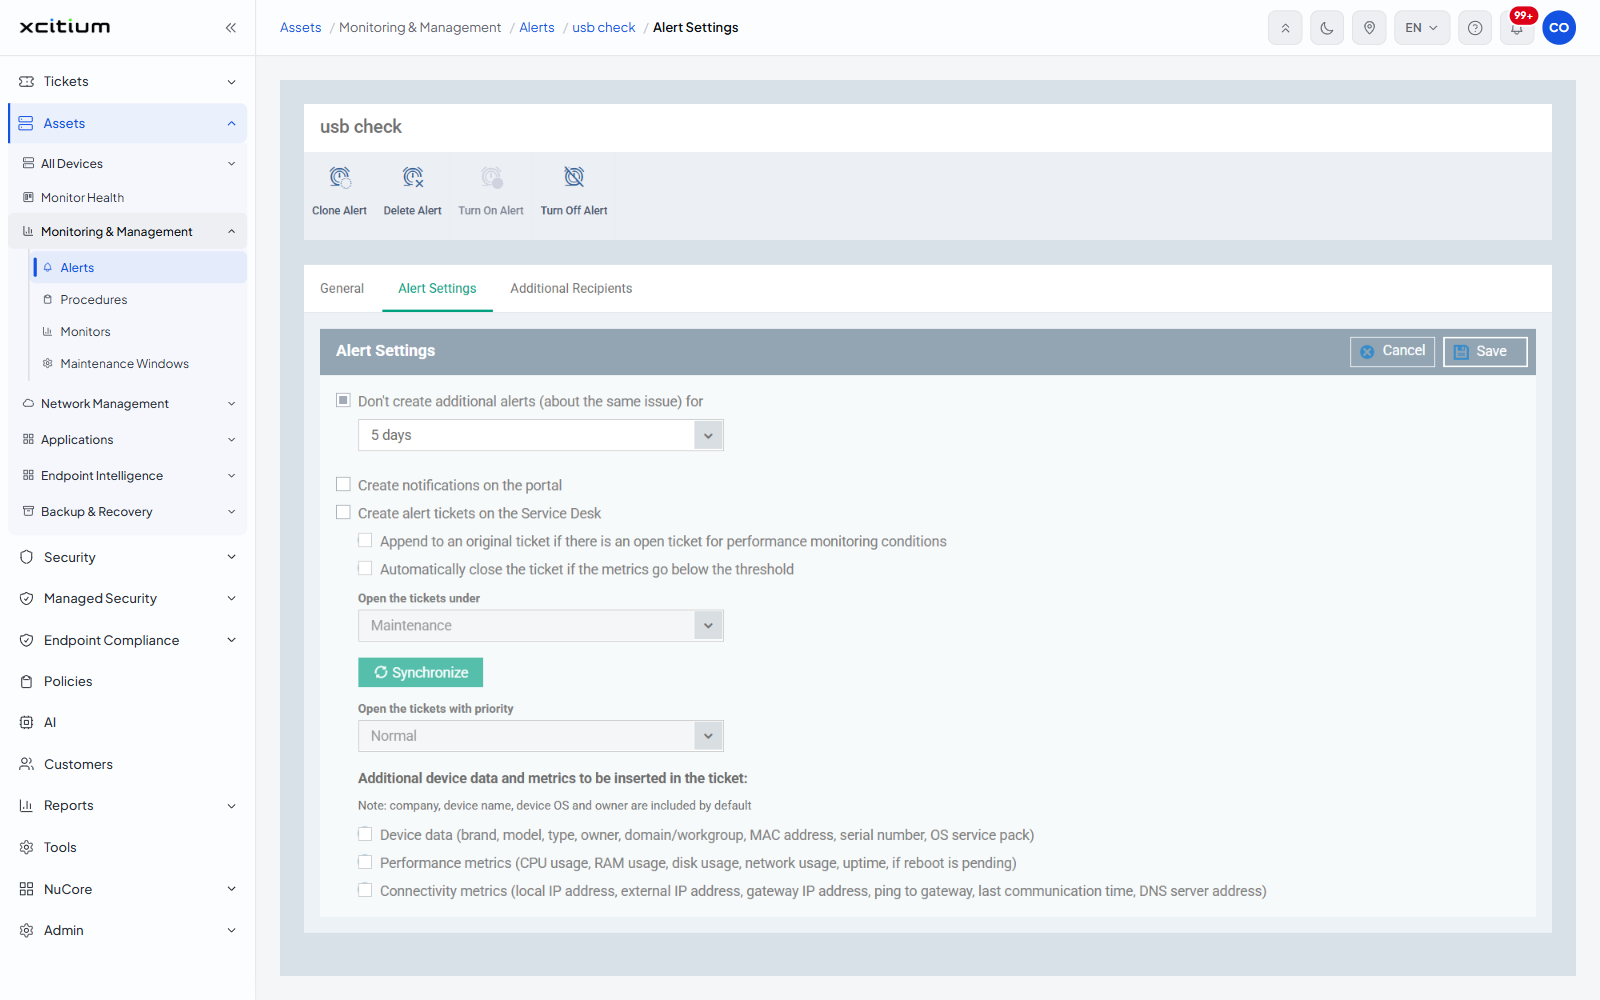
The settings
| Setting | Type | Options / default |
| Don't create additional alerts (about the same issue) for | Checkbox with dropdown | Stops the same issue alerting repeatedly. The dropdown offers '5 minutes', '10 minutes', '30 minutes', '1 hour', '2 hours', '3 hours', '6 hours', '12 hours', '1 day', '2 days', '5 days'. |
| Create notifications on the portal | Checkbox | Raises a notification in the console when the alert fires. |
| Create alert tickets on the Service Desk | Checkbox | Opens a ticket when the alert fires. Ticking it enables the four controls below. |
| Append to an original ticket if there is an open ticket for performance monitoring conditions | Checkbox | Adds to the existing ticket instead of opening another. |
| Automatically close the ticket if the metrics go below the threshold | Checkbox | Closes the ticket once the condition clears. |
| Open the tickets under | Dropdown | The service desk department the ticket is raised in. A 'Synchronize' button beside it refetches the department list. |
| Open the tickets with priority | Dropdown | 'Low', 'Normal', 'High', 'Critical'. |
Additional device data and metrics to be inserted in the ticket
Under the note 'Note: company, device name, device OS and owner are included by default.'
| Checkbox | What it adds |
| Device data | Brand, model, type, owner, domain or workgroup, MAC address, serial number and OS service pack. |
| Performance metrics | CPU usage, RAM usage, disk usage, network usage, uptime and whether a reboot is pending. |
| Connectivity metrics | Local IP address, external IP address, gateway IP address, ping to gateway, last communication time and DNS server address. |
Make an alert open a ticket
- Open the alert and click the 'Alert Settings' tab.
- Click 'Edit'.
- Tick 'Create alert tickets on the Service Desk'.
- Set 'Open the tickets under' to the right department, using 'Synchronize' if the list looks stale.
- Set 'Open the tickets with priority'.
- Tick the device and metric data you want carried into the ticket.
- Click 'Save'.
Note: 'Don't create additional alerts (about the same issue) for' is what stops a flapping condition opening a ticket every few minutes.