
Comodo Help
Find the desired product help
Xcitium MSP

Xcitium MSP

Xcitium MSP Administrator Guide

English

Print Help
Security > Endpoint Security > Alerts > Device View
  • Introduction
    • Key Concepts
    • Best Practices
    • Log In To The Console
      • Reset Your Password
    • The Admin Console
    • The Dashboard
  • Tickets
    • Dashboard
    • Create Ticket
    • AI Queue
      • Processing Now
      • Auto-Resolved Today
      • Escalated To Technicians
    • Technician Queue
      • My Tickets
      • Unassigned Tickets
      • Assign A Ticket From The Unassigned Queue
    • Management
      • All Tickets
        • Ticket Detail
          • Edit A Ticket
          • Reply To A Ticket Or Add An Internal Note
          • View The Activity Log
          • Reassign A Ticket
          • Change Ticket Priority
          • Manage Ticket Attachments
          • Resolve, Close And Reopen A Ticket
          • Merge Tickets
          • AI Insights On A Ticket
          • SLA Status On A Ticket
      • SLA Dashboard
      • AI Integrations
      • AI Playbooks
        • Create A Playbook
        • Playbook Approvers
        • Playbook Tools
      • AI Assignee Management
        • Add An Assignee
        • Add A New User
  • Assets
    • All Devices
      • Device List
        • Filter The Device List
        • Group Management
          • Create A Device Group
        • Enroll A Device
          • Set The Enrollment Options
          • Send The Enrollment Link
          • Enrollment Reference Pages
        • Device Details
          • View And Edit The Device Name
          • View Device Summary Information
          • View Network Information
          • View Policies Associated With A Device
            • Review Profile Suggestions
          • View Applications Installed On A Device
          • View The Command Queue
          • View MSI Installation State
          • View And Manage Patches On A Device
          • View A Device's Groups
          • View Device Logs
          • Manage A Device's Policies
          • Run A Procedure On A Device
          • Install And Manage Packages On A Device
          • Reboot Or Shut Down A Device
          • Collect Performance Logs
          • Change A Device's Owner
          • Delete A Device
      • Bulk Installation Package
        • Customize A Bulk Package
        • Download Remote Control
    • Monitor Health
      • Customize The Monitor Health Cards
    • Monitoring And Management
      • Alerts
        • Create An Alert
        • Configure Alert Settings
        • Set Alert Recipients
      • Procedures
        • Manage Procedure Folders
        • Filter The Procedures List
        • Create A Procedure
        • A Procedure's General Tab
        • View And Edit A Procedure's Script
        • A Procedure's Schedule Tab
        • A Procedure's Execution Log
          • View Execution Details Of A Run
        • A Procedure's Parameters Tab
        • Run A Procedure
        • Clone, Export And Delete Procedures
      • Monitors
        • Filter The Monitors List
        • Create A Monitor
        • A Monitor's General Tab
        • A Monitor's Conditions Tab
          • Add A Performance Condition
          • Add A File Size Condition
          • Add A Folder Size Condition
          • Add A Disk Condition
          • Add A Service Condition
          • Add A Process Condition
          • Add An Event Condition
          • Add A TCP Condition
          • Add A Ping Condition
          • Add A Web Page Condition
          • Add A Device Status Condition
          • Add A Custom Script Condition
          • Add A Security Events Condition
          • Add A Security Client Events Condition
          • Add An OS Patches Event Condition
        • A Monitor's Policies Tab
        • A Monitor's Logs Tab
        • Clone, Import, Export And Delete Monitors
      • Maintenance Windows
        • Add A Maintenance Window
        • Maintenance Window Settings
        • View A Maintenance Window
        • Filter The Maintenance Windows List
    • Network Management
      • Discoveries
        • Filter The Discoveries List
        • Create A Discovery
        • A Discovery's General Tab
        • Discovery Auto Enrollment
        • Discovery Notifications
        • Schedule A Discovery
        • Discovery Logs
        • Clone And Delete Discoveries
      • Network Profiles
        • A Network Profile's Tabs
      • Network Devices
        • Filter The Network Devices List
      • Network Monitors
        • A Network Monitor's Tabs
        • A Network Monitor's Conditions Tab
          • Add A Network Uptime Condition
          • Add A Network Performance Condition
          • Add A Network Disk Condition
          • Add A Network Device Status Condition
          • Add An OID Condition
      • Blueprints
        • A Blueprint's Tabs
          • Add A Blueprint Condition
    • Applications
      • Desktop Application Control
        • Filter The Software Inventory
        • An Application's Pages
        • Create A File Group Variable
        • The Windows Application Store
      • Mobile Application Control
      • Patch Management
        • Filter The Patch List
        • A Patch's Info Pages
        • Create A Windows Patch Procedure
        • Third Party Application Patches
    • Endpoint Intelligence
      • The Endpoint Intelligence Dashboard
      • Device Queries
        • The Schema Reference
      • The Query Library
      • Endpoint Intelligence Monitors
        • Create An Endpoint Intelligence Monitor
  • Security
    • Threat Dashboards
      • Endpoint Threat Dashboard
      • Cloud Threat Dashboard
        • Add A Cloud Account
        • Add A Cluster, Registry Or Code Repository
      • Endpoint Compliance Dashboard
        • Choose The Endpoint Compliance Widgets
      • CTEM Dashboard
      • CTEM Metrics
      • Xcitium Verdict Cloud Dashboard
        • Choose The Xcitium Verdict Cloud Widgets
    • Endpoint Security
      • Alerts
        • Alert Search
          • Alert Search Filters
          • The Alert List
          • Alert Detail
            • Alert Detail For An EDR Alert
            • Alert Detail For A MITRE-Mapped Alert
        • Hash View
          • File Details
        • Device View
          • Device Detail
        • Alert Policy
          • Alert Policy Detail
            • The Condition Editor
          • Create An Alert Policy
        • Suppression Rules
          • Add A Suppression Rule
            • Query Builder Help
      • EXDR
        • Event Search
        • Choose Aggregation Fields And Result Columns
        • Hash Search
        • Device Search
        • Android Threat History
        • Event View
        • File View
        • Device View
      • Security Status
        • Antivirus Scan History
      • Blocked Threats
      • Quarantined Threats
      • Contained Threats
        • Contained File Details
      • EDR Events
      • Firewall Events
      • Autorun Alerts
      • File Rating
        • Detected Scripts
        • Obsolete Files
      • File Verdicts
      • Device Control
      • DLP Configuration
        • Create A Discovery Rule
        • Create A Monitoring Rule
      • DLP Events
        • DLP Logs
        • DLP Quarantined Files
      • Vulnerability Management
        • Vulnerable Devices
    • SIEM - X
      • Event Collection Summary
      • Event Query
      • Long Term Analysis
      • Report Generation
      • Token Management
        • Network Settings
        • User Settings
        • Sensor Settings
    • Cloud Security
      • Issues
        • Findings Summary
        • Rule Engine
        • Registry Scan
      • Cloud Assets
      • Clusters
      • Compliance
        • Compliance Detailed View
      • Runtime Protection
        • Runtime Policies
      • Ticket Summary
      • Cloud Alerts
        • Alert Triggers
      • Cloud Reports
      • API Security
        • API Specification
        • API Scan
    • Network Security
    • Email Security
      • Email Protection
    • Threat Labs
  • Managed Security
    • Service
      • Alerts, Incidents And Website Vulnerabilities
      • Customer Health
      • Add A New Customer
      • Import Customers
    • Customer Summary
    • Service Summary
    • Incidents
    • Log Collection Summary
    • Reporting
    • Tickets
      • Create A New Ticket
  • Endpoint Compliance
    • Work With Endpoint Compliance Lists
    • Agents
      • LightWeight Agents
      • Probe Agents
      • Deprecated Agents
      • Download And Install An Agent
    • All Assets
      • All Assets - Table View
      • View Asset Details
      • Asset Inventory Tabs
      • Asset Problems, Solutions And Compliance
    • Other Assets
    • Deprecated Assets
    • Problems
    • Solutions
    • Pending OS Patches
    • Ports
    • Patch Management
    • Application Baseline Results
    • Certificates
    • Vulnerabilities
    • Application Vulnerabilities
    • Vulnerability By OS
    • OS Vulnerabilities
    • Network Scan Findings
    • Compliance Standards
    • Compliance Assessment
    • Compliance Check Master
    • Discovery Settings And Credentials
    • Manage Mapping
    • Jobs
    • Alerts
  • Policies
    • The Profile List
      • Create A Profile
      • Import A Profile
      • Export, Clone And Delete Profiles
      • Filter The Profile List
    • Policy Configuration
      • Create A Policy
      • Import A Policy
      • Export And Delete Policies
    • Default Policies
    • Predefined Policies
    • The Policy Editor
      • Policy General Settings
      • Policy Associated Devices
      • Add And Remove Policy Sections
      • Policy Antivirus Settings (Linux)
      • Policy Sections By Operating System
    • The Profile Editor
      • Sections Configuration
      • Add And Remove Profile Sections
      • Profile Sections On Other Operating Systems
      • General (Windows Profile)
      • Associated Devices (Windows Profile)
      • Profile Health Check
      • Client Updates
      • EXDR Updates
      • Remote Control
      • Client UI Settings
      • Client Rebranding
      • Client Proxy
      • Client Access Control
      • Remote Tools
      • Monitors
      • Procedures
      • Patch Management
      • Maintenance Window
      • Global Proxy
      • Client Logging Settings
      • Antivirus
      • Firewall
      • EDR
      • File Rating
      • Containment
      • VirusScope
      • Xcitium Verdict Cloud
      • Agent Discovering Settings
      • External Devices Control
      • Miscellaneous
      • Script Analysis
      • Data Loss Prevention
      • XCS Access Control
      • XCS Proxy
      • XCS Updates
      • XCS UI Settings
      • XCS Logging Settings
      • Performance
      • Applications
      • Chat
      • Thumbnails
  • AI
    • Manage Your AI Agents
      • AI Agent Card Actions
    • Switch Between AI Agents
    • Account Settings
    • Add A New AI Agent
      • Add An AI Agent From The Marketplace
    • Request A Managed AI
    • Manage An AI Agent
      • Agent Dashboard
      • Agent Design
        • Embed The Agent On Your Website
      • Agent Integrations
      • Playbooks
      • Ticket Management
        • Assignee Management
      • Approvers
      • Channels
      • Chat History
      • Agent Repository
      • Try Agent
      • Chat Agent Dashboard
      • Question & Answer
      • AI Cache
      • Candidates
      • Interview Questions
      • Keyword Search
    • AI Training
      • Manage A Training Repository
    • Captured Contacts
      • Custom Contact Fields
      • Email Notification Settings
    • Integrations
      • Webhook Request
  • Customers
    • Add A Customer
    • Edit A Customer
    • Delete A Customer
  • Reports
    • Standard Reports
      • On-Demand Reports
      • Scheduled Reports
      • Create A New Report
      • Edit A Scheduled Report
    • Custom Reports
      • The Report Catalogue
      • Configure And Generate A Custom Report
      • Generated Reports
        • View Generated Report Details
      • Advanced Reports
        • The Advanced Reports Screen
        • Quick Start: Your First Advanced Report
        • Pick The Data For A Report
        • Filter Rows
        • Count And Group Results
        • Change The Chart Or Table
        • Build A Multi-Step Report
          • Sort And Limit Rows
          • Add A Custom Column
          • Combine Two Tables (Join)
        • Save, Open And Manage Reports
        • Download Results And View The SQL
        • Toolbar And Bottom Bar Reference
        • Troubleshooting And Limits
      • Reports Beta
        • Reports Beta: Scheduled Reports
        • Reports Beta: Create A Report
    • SLA Reports
    • Audit Logs
      • Filter The Audit Log
  • Tools
    • The Tool Card And Its Controls
    • Download And Use A Tool
    • Xcitium Cleaning Essentials
    • Threat Hunter Assessment Tool
    • Auto Discovery And Deployment Tool
    • Xcitium Remote Control
    • ITarian Remote Access
    • Agent Removal Tool
  • NuCore
  • Admin
    • Staff
      • Add A Staff Member
      • Edit A Staff Member
    • Users
      • User List
        • View A User
        • Create A User
        • Import Users
      • User Groups
      • Role Management
        • Role Permissions And Scope
    • Integrations
      • Office 365
      • AWS
      • SentinelOne
      • Windows Defender
      • Microsoft Entra
      • Google Workspace
      • CrowdStrike
      • Azure Active Directory
    • Licenses
      • License Details
      • Bill Forecast
      • License Allocations
    • Account
      • Your Account
      • Remote Access Support
    • Settings
      • Ticketing Settings
      • System Templates
      • Portal Setup
      • Dashboard Settings
      • CTEM
      • Data Protection Templates
      • Android EMM
      • Apple Business Manager
      • Support

Device View


  • Click 'Security' > 'Endpoint Security' > 'Alerts' > 'Device View' to open this interface.

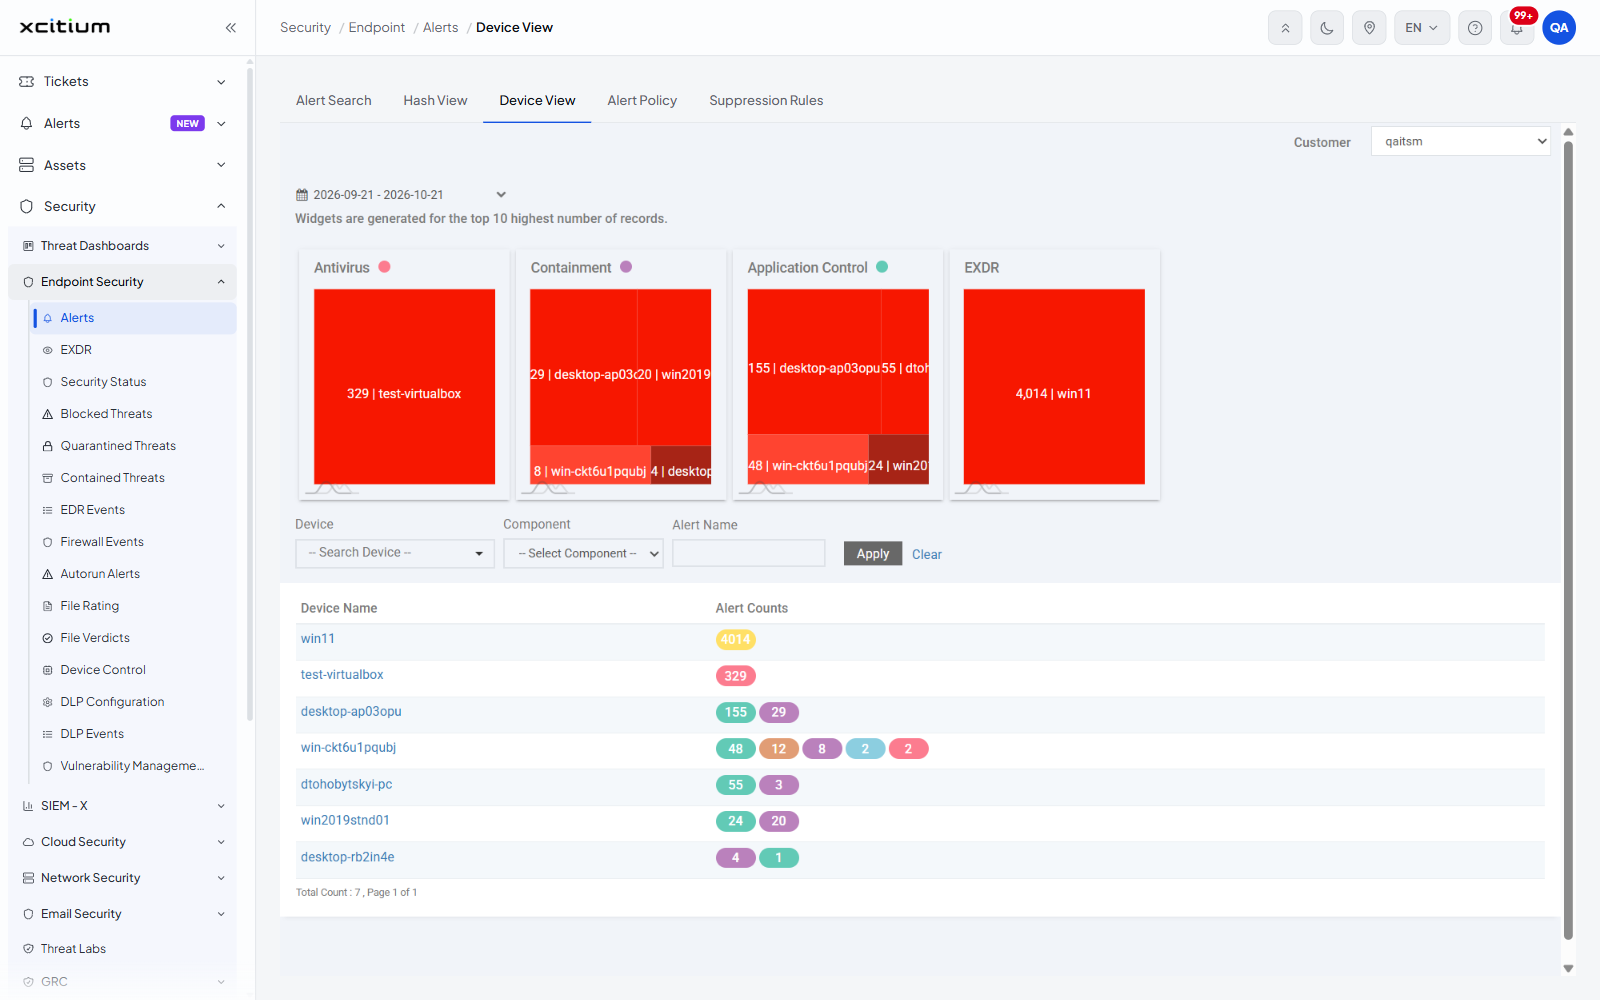
'Device View' shows the same alerts as 'Alert Search' but grouped by the device they came from, so there is one row per device. It is the view to use when you want to know which machines are generating the alerts.

You can set the period the view covers, read the top ten devices per component from the widgets, filter the list, open a device's own record, and jump from a count straight to the alerts behind it.
Xcitium_MSP_1.png

The parts of the tab

Area Description
Customer A drop-down at the top right that scopes the tab to one customer.
Time range The control at the top left, showing the period as two dates. It carries a calendar icon and the tooltip 'Time Range Selection', and offers the same choices as on 'Hash View'.
Widgets One tile per component with alerts in the period, under the line 'Widgets are generated for the top 10 highest number of records.'
Filter bar Three filter controls followed by 'Apply' and 'Clear'.
Device list The results table.
Pager A line at the bottom left reading 'Total Count : n , Page x of y'. Page links appear at the bottom right when there is more than one page.

The widgets

One tile is drawn for each component that raised alerts in the period, for example 'Antivirus', 'Containment', 'Application Control' and 'EXDR'. Each component name carries a coloured dot, and the same colour is used for that component's badge in the 'Alert Counts' column. Inside the tile, one block stands for one device, labelled with the number of alerts and the device name, for example '4,014 | win11'. Only the ten devices with the most alerts are drawn.

The filters

Filter Control Description
Device Search box with suggestions The device to show. The box reads '-- Search Device --' until you type; type at least one character and the matching devices appear beneath it.
Component Drop-down list The component that raised the alerts. Options are '-- Select Component --' (the default), 'Antivirus', 'Containment', 'Application Control', 'Autoruns Control', 'Virtual Desktop', 'Containment Activity' and 'EXDR'.
Alert Name Text box An alert name to match. Free text, no placeholder.

Filter the device list

  1. Choose the customer and set the period.

  2. Set one or more filters.

  3. Click 'Apply'. The list reloads with the devices that match.

  4. Click 'Clear' to drop the filters.

The columns

Column Description
Device Name The name of the managed device, shown as a link. Click it to open the device's own record. 
Alert Counts How many alerts the device raised, in coloured badges. A device with alerts from more than one component shows one badge per component, in the colour of that component's widget. Each badge is a link that opens 'Alert Search' filtered to that device and that component.

Open the alerts behind a count

  1. Find the device in the list.

  2. Click the coloured count badge for the component you are interested in. The alert list for that device and component opens.


The list shows the busiest device first.


Our Products
  • Free Antivirus
  • Free Internet Security
  • Website Malware Removal
  • Free Anti-Malware
  • Anti-Spam (Free Trial)
  • Windows Antivirus
  • Antivirus for Windows 7
  • Antivirus for Windows 8
  • Antivirus for Windows 10
  • Antivirus for MAC
  • Antivirus for Linux
  • Free Endpoint Security
  • Free ModSecurity
  • Free RMM
  • Free Website Malware Scanner
  • Free Device Manager for Android
  • Free Demo
  • Network Security
  • Endpoint Protection
  • Antivirus for Android
  • Comodo Antivirus
  • Wordpress Security
Cheap CDN
  • Bootstrap CDN
  • Semantic UI CDN
  • Jquery CDN
  • CDN Plans
  • CDN
  • Free CDN
Enterprise
  • Patch Management Software
  • Patch Manager
  • Service Desk
  • Website Down
  • Endpoint Protection Solutions
  • Website Security Check
  • Remote Monitoring and Management
  • Website Security
  • Device Manager
  • ITSM
  • CRM
  • MSP
  • Android Device Manager
  • MDR Services
  • Managed IT Support Services
  • Free EDR
Free SSL Certificate
Support Partners Terms and Conditions Privacy Policy

© Comodo Group, Inc. 2026. All rights reserved.