


Event Collection Summary
- Click 'Security' > 'SIEM - X' > 'Event Collection Summary' to open this interface. The panel is titled 'Data Collection Summary'.
Event Collection Summary tells you whether log data is actually arriving. It charts the volume over a period you choose and lists the collection status of every customer, so you can spot a sensor that has stopped reporting.
You can change the period, refresh the figures and expand a customer to see each of its collectors.
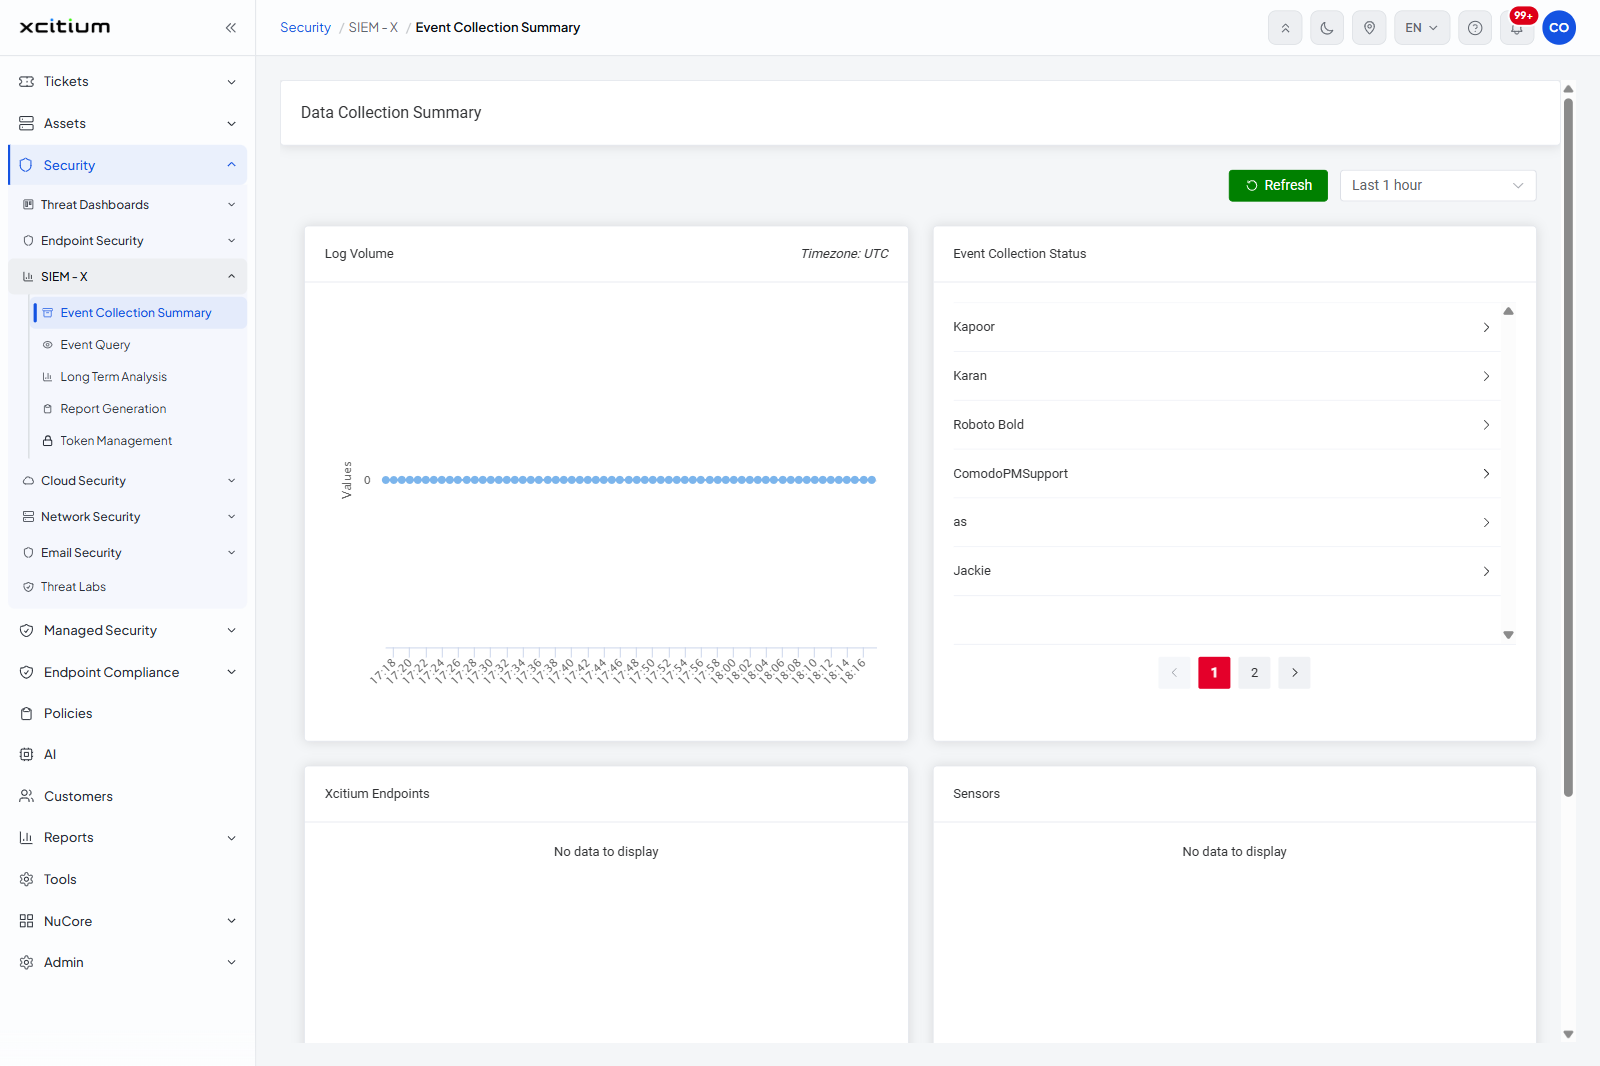
The controls
| Control | Description |
| Refresh | Reloads the chart and the status list. |
| Period list | Shows 'Last 1 hour' when the page opens. The choices are 'Last 1 hour', 'Last 3 hours', 'Last 12 hours', 'Last 1 day', 'Last 3 days' and 'Last 1 week'. |
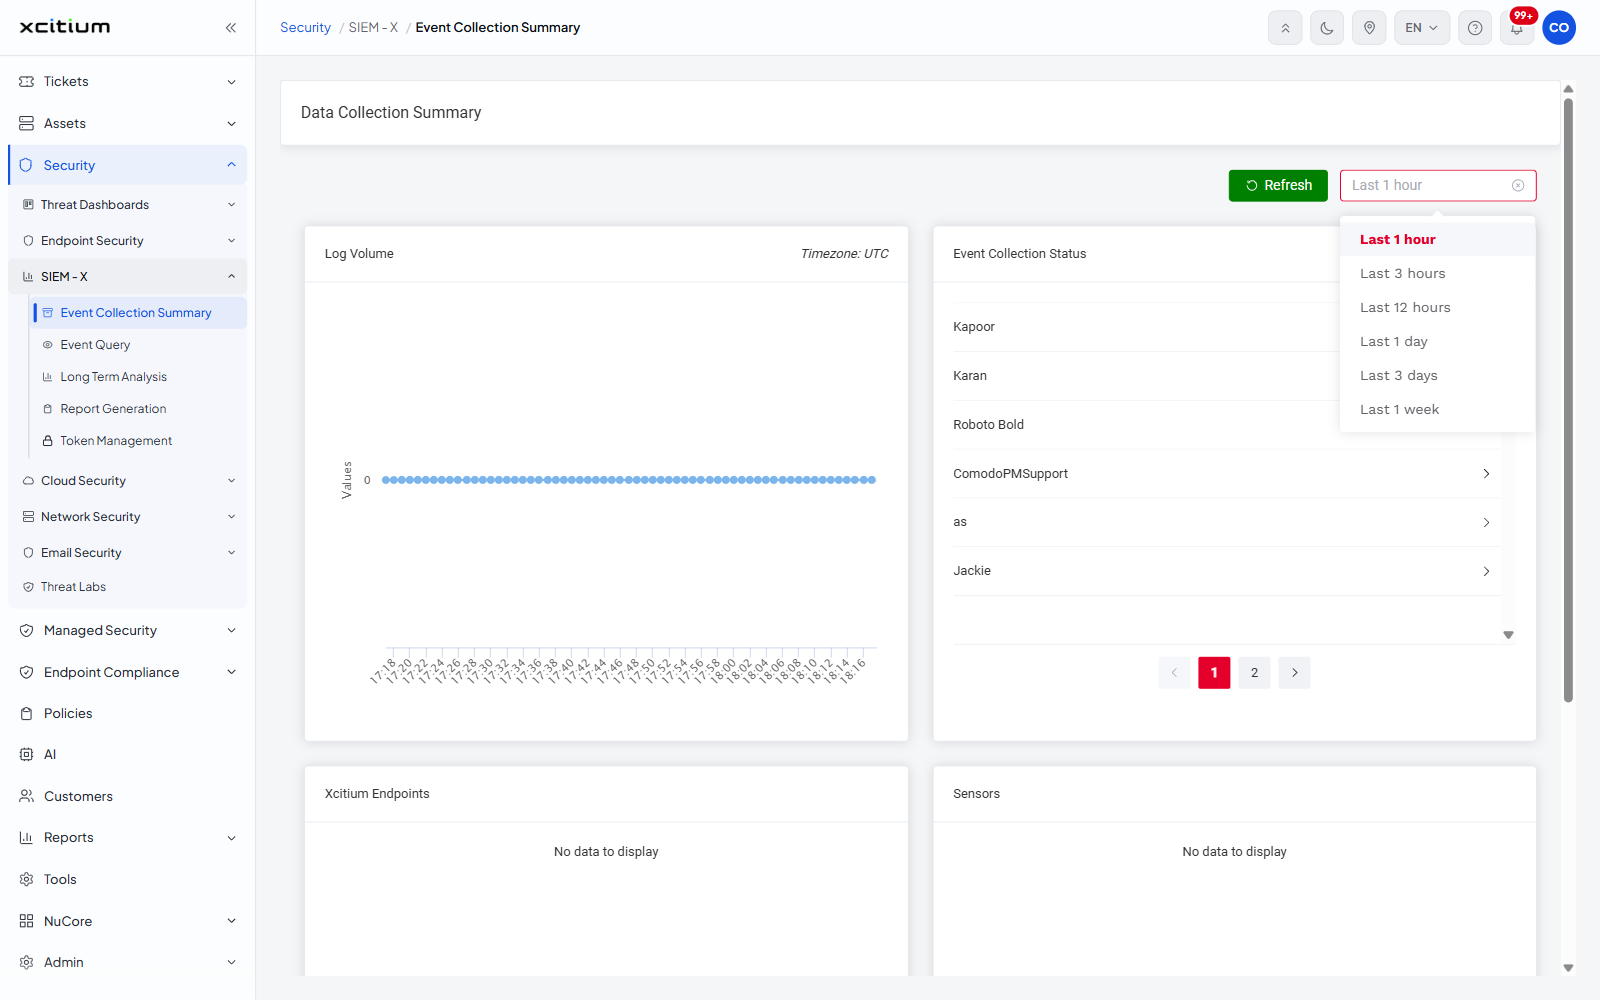
The panels
| Panel | Description |
| Log Volume | A line chart of event counts across the chosen period. The vertical axis is labelled 'Values' and the panel is annotated 'Timezone: UTC'. |
| Event Collection Status | A paged list of your customers, one row each, with a chevron that expands the row. |
| Xcitium Endpoints | Collection from the endpoint agents. Empty state 'No data to display'. |
| Sensors | Collection from the network sensors. Empty state 'No data to display'. |
Check a customer's collectors
- Find the customer in 'Event Collection Status'. Use the page numbers at the foot of the panel if it is not on the first page.
- Click the row, or the chevron at the end of it. The row expands.
- Read the two columns that appear: 'Sensor Token' and 'Status'.
- Click the row again to collapse it.
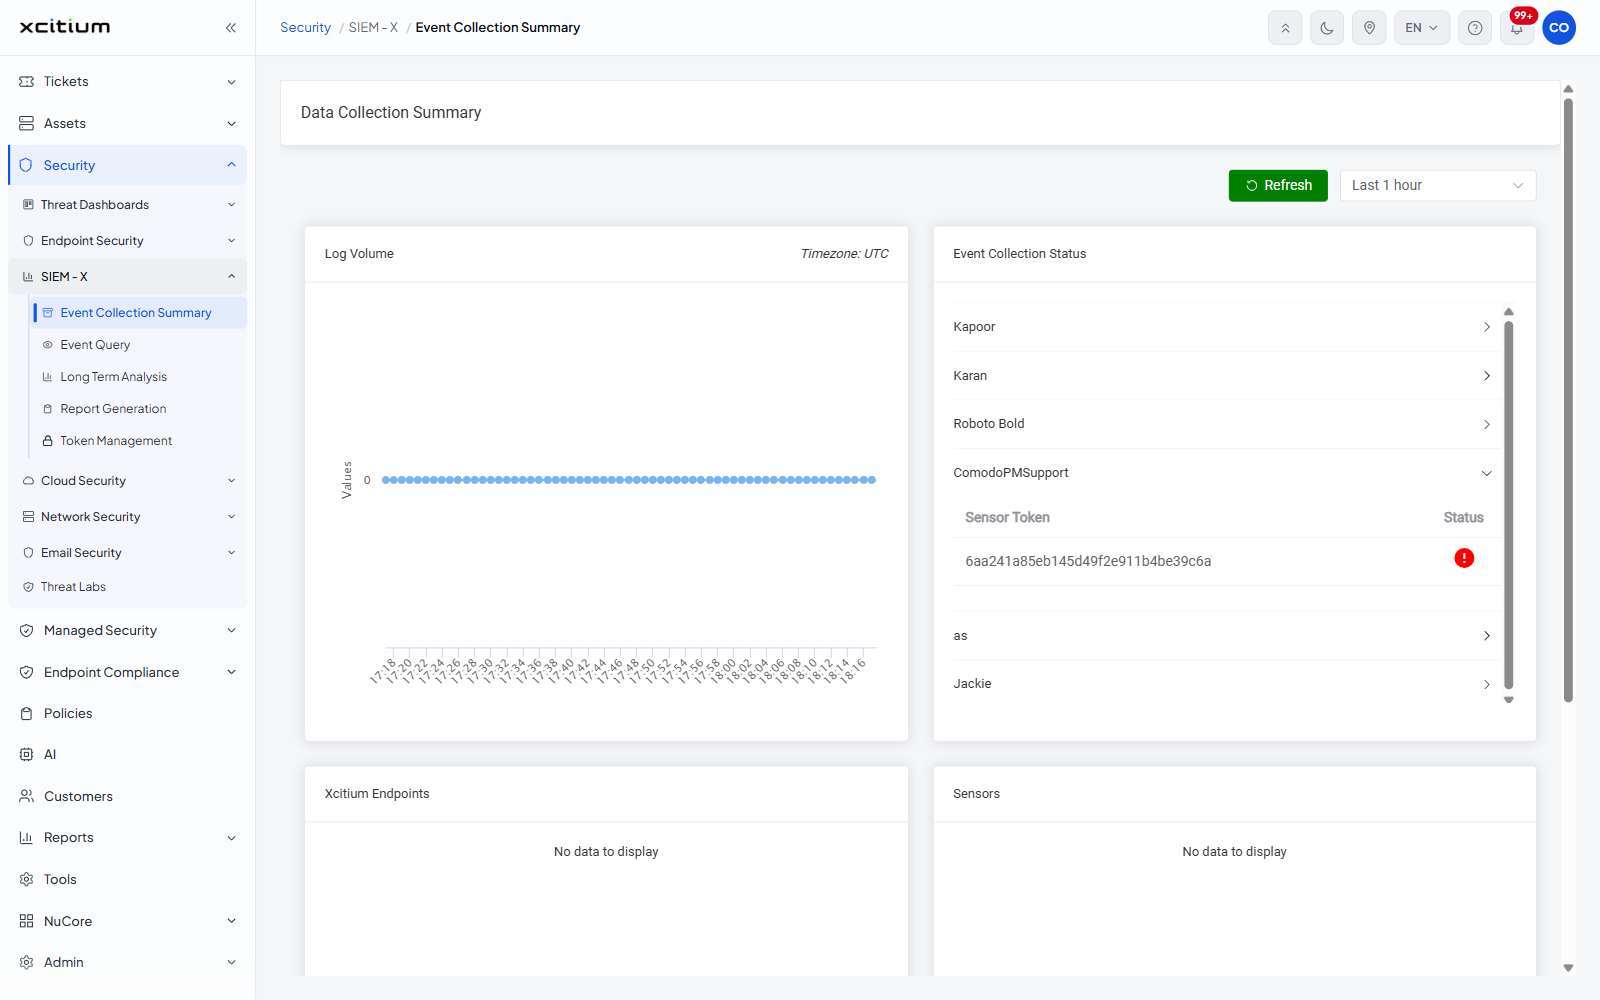
Note: the chart is drawn in UTC, as the 'Timezone: UTC' note on the panel says, so it will not line up with local time.