


Device Search
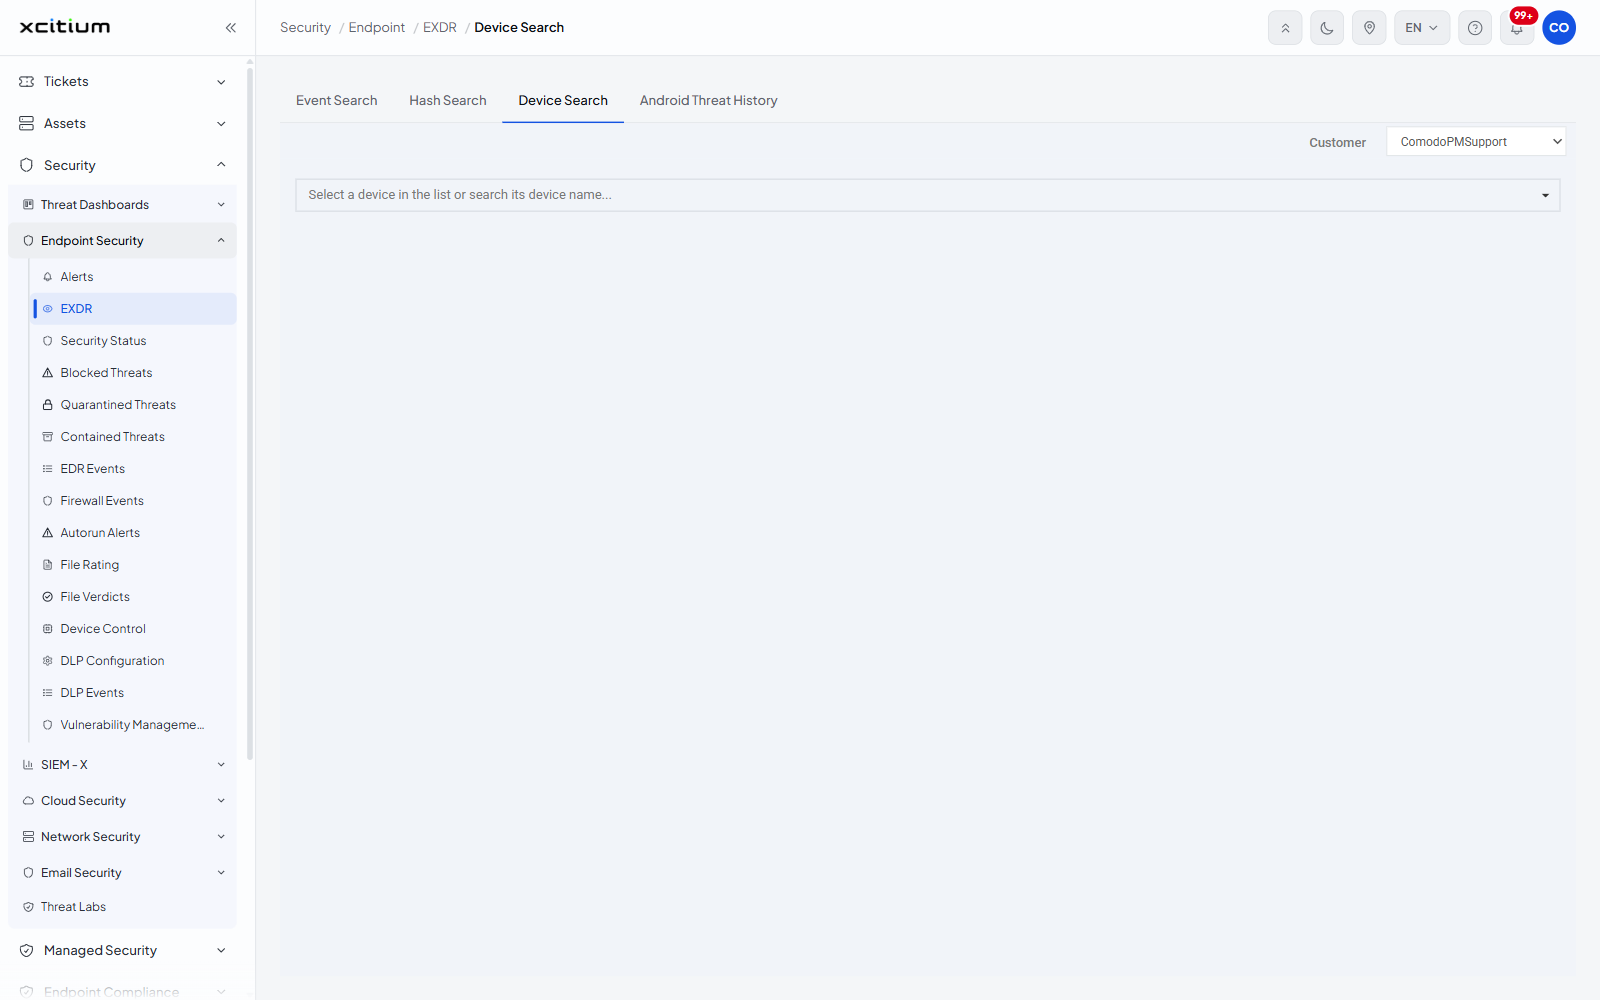
- Click 'Security' > 'Endpoint Security' > 'EXDR' > 'Device Search' to open this interface.
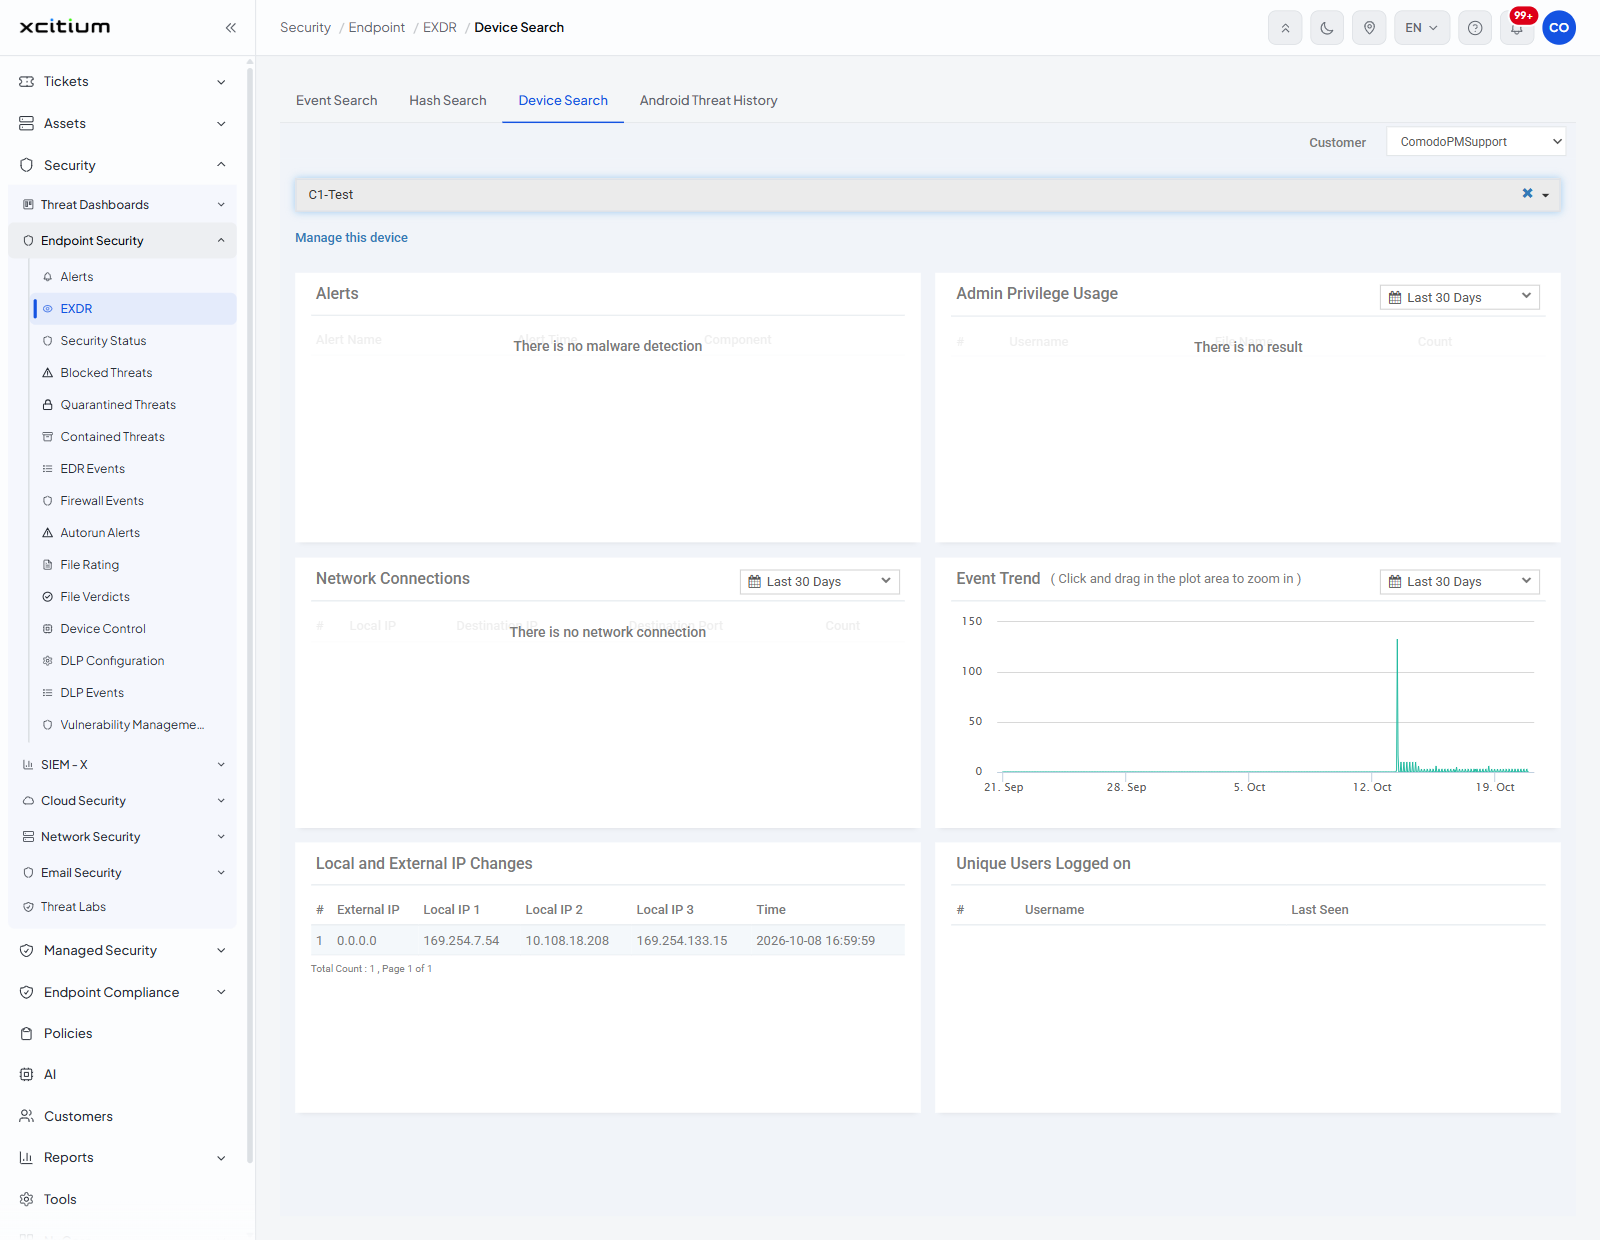
Device Search puts everything the platform recorded for one device on a single page: its alerts, which accounts used administrative rights, which network connections it made, how its event volume has moved, how its addresses changed and who logged on.
You can pick a device, read its activity panels and jump to the device's management page.
Pick a device
- Pick a customer in the 'Customer' list at the top right.
- Click the box reading 'Select a device in the list or search its device name...'.
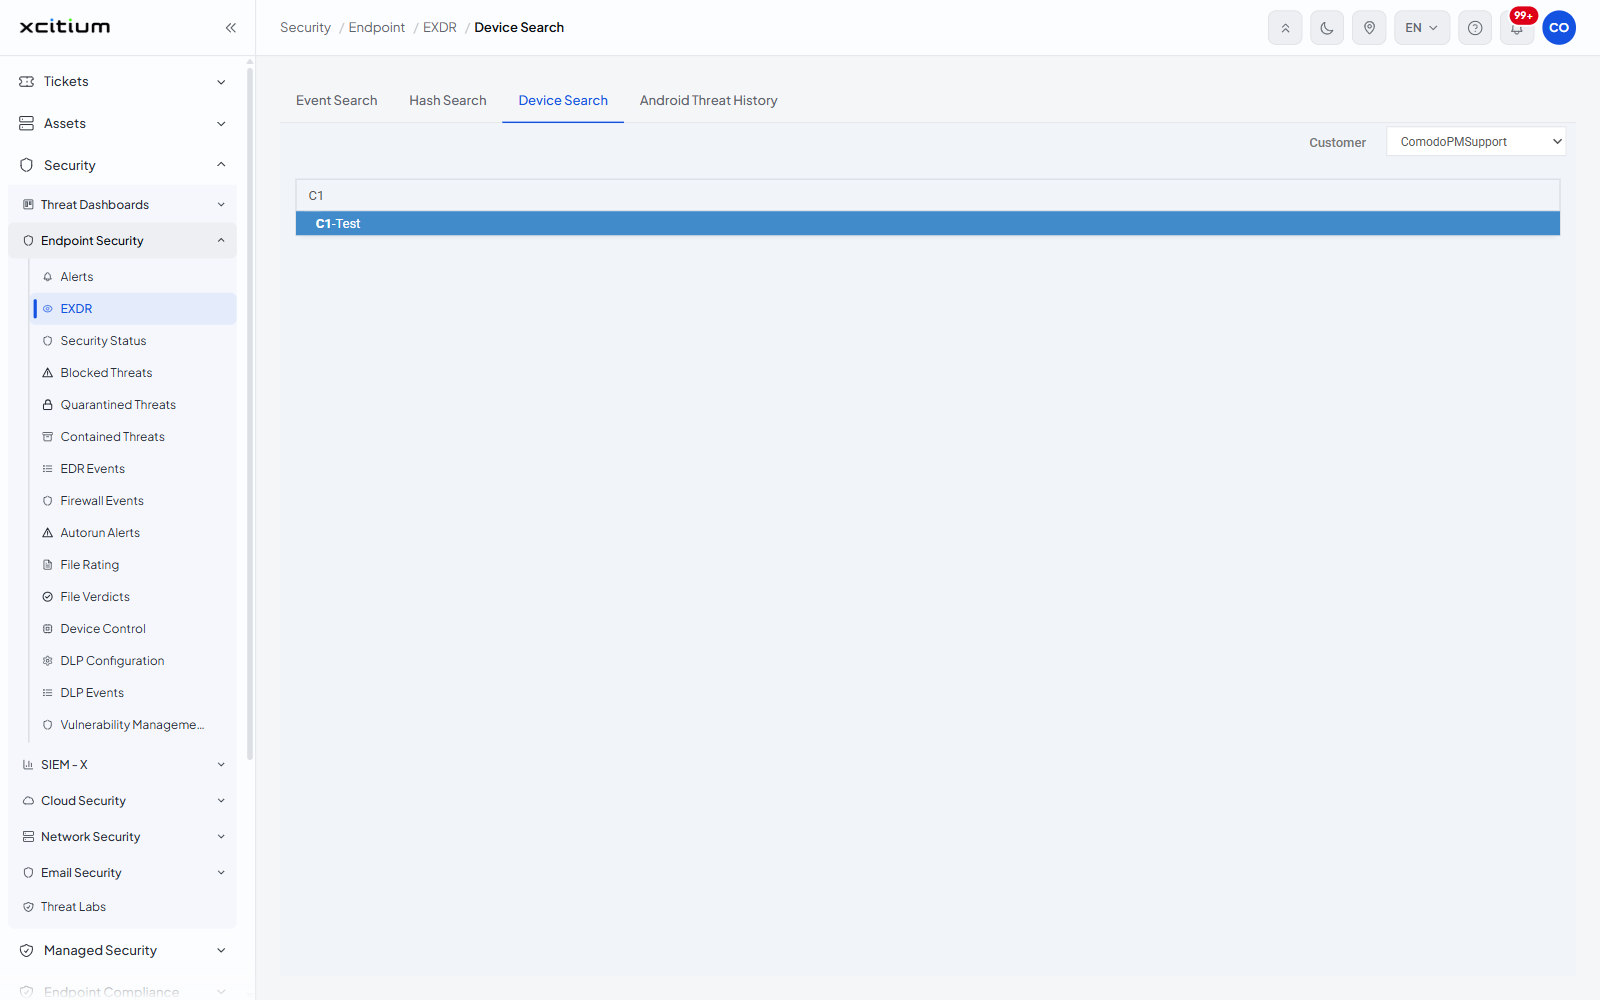
- Start typing the device name. The list filters as you type.
- Click the device. The page fills with its panels.
The panels
| Panel | What it shows |
| Manage this device | A link that opens the device in the device management console. |
| Alerts | Columns 'Alert Name', 'Alert Time' and 'Component'. Empty state 'There is no malware detection'. |
| Admin Privilege Usage | Columns '#', 'Username', 'File Name' and 'Count'. Empty state 'There is no result'. |
| Network Connections | Columns '#', 'Local IP', 'Destination IP', 'Destination Port' and 'Count'. Empty state 'There is no network connection'. |
| Event Trend | A chart of event volume over time, captioned '( Click and drag in the plot area to zoom in )'. |
| Local and External IP Changes | Columns '#', 'External IP', 'Local IP 1', 'Local IP 2', 'Local IP 3' and 'Time', with its own result counter and paging. |
| Unique Users Logged on | Columns '#', 'Username' and 'Last Seen'. |
Zoom into part of the event trend
- Point at the 'Event Trend' chart.
- Click and drag across the part of the timeline you want.
- The chart redraws for that span.
Note: the device picker only lists devices belonging to the customer selected in the 'Customer' list. Switch customer first if you cannot find the device.