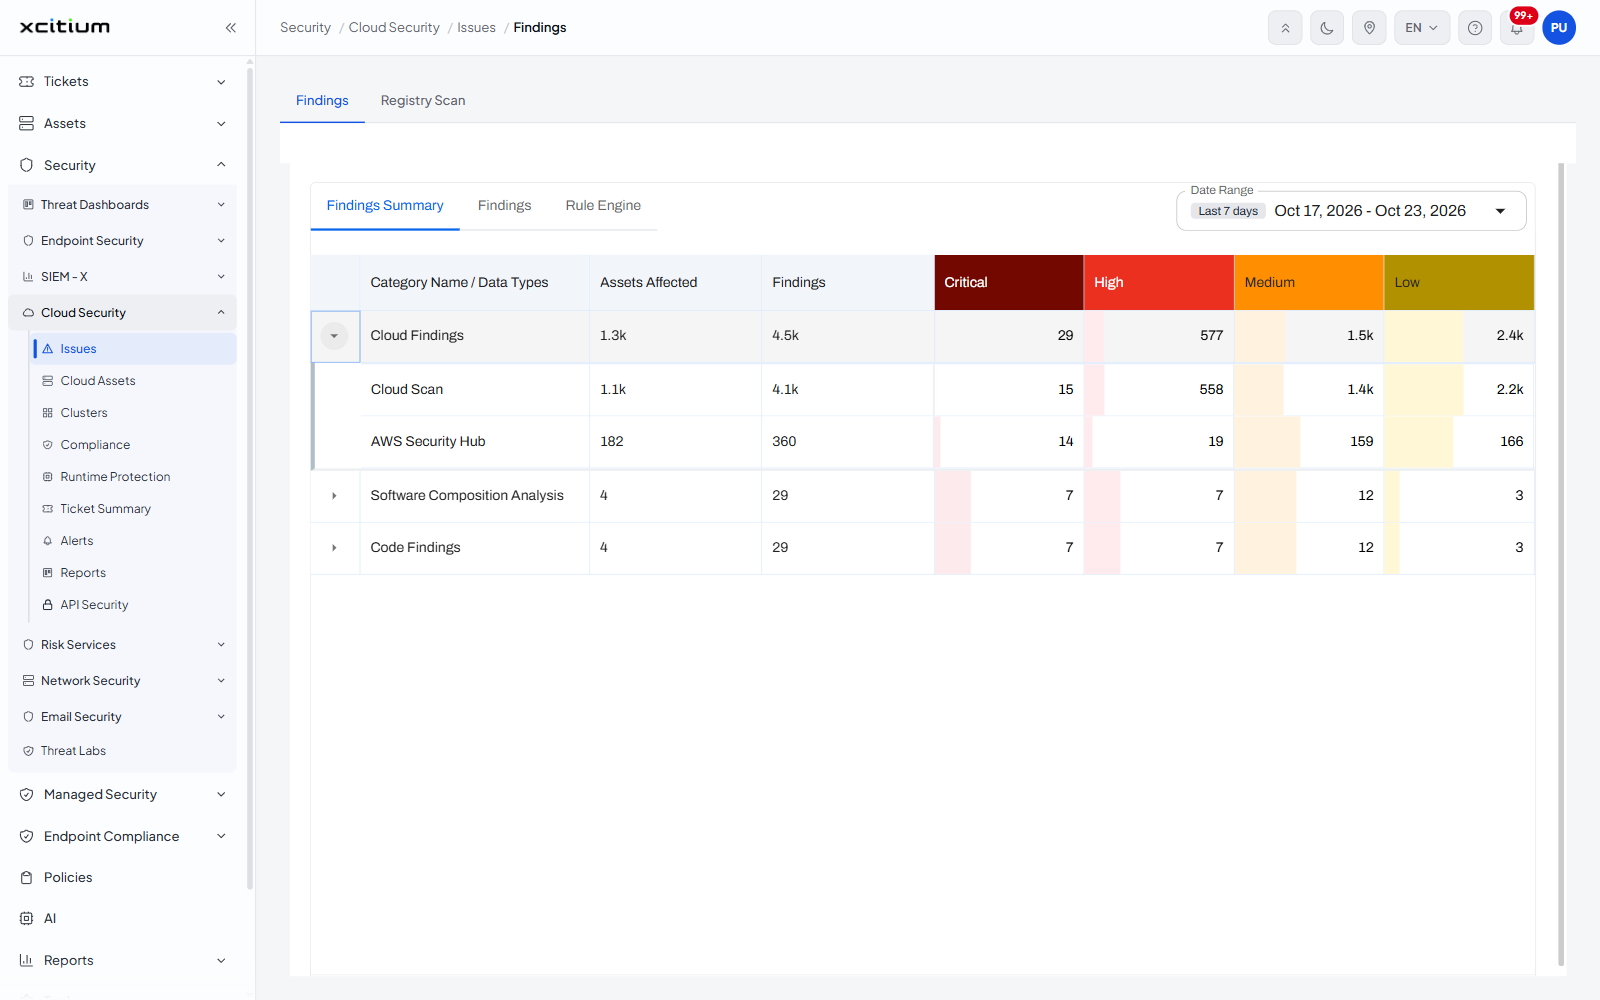
Findings Summary
- Click 'Security' > 'Cloud Security' > 'Issues', then click the 'Findings Summary' tab to open this interface.
Findings Summary counts the findings instead of listing them. Each row is a category of finding, with the number of assets affected, the total number of findings, and a breakdown by severity. It is the quickest way to see where the weight of the problem sits before you open the full list.
You can change the period the counts cover and expand a category to see the sources that make it up.
Column descriptions
| Column | Description |
| (expander) | A chevron at the start of each row. Click it to show the data types that make up the category. |
| Category Name / Data Types | The category of finding at the top level, and the scan or source that produced them when the row is expanded. |
| Assets Affected | How many assets carry at least one finding in that category. Large numbers are abbreviated, for example '1.3k'. |
| Findings | The total number of findings in the category. |
| Critical | How many of them are critical. The heading sits on a dark red background. |
| High | How many are high. The heading sits on a red background. |
| Medium | How many are medium. The heading sits on an orange background. |
| Low | How many are low. The heading sits on a yellow background. |
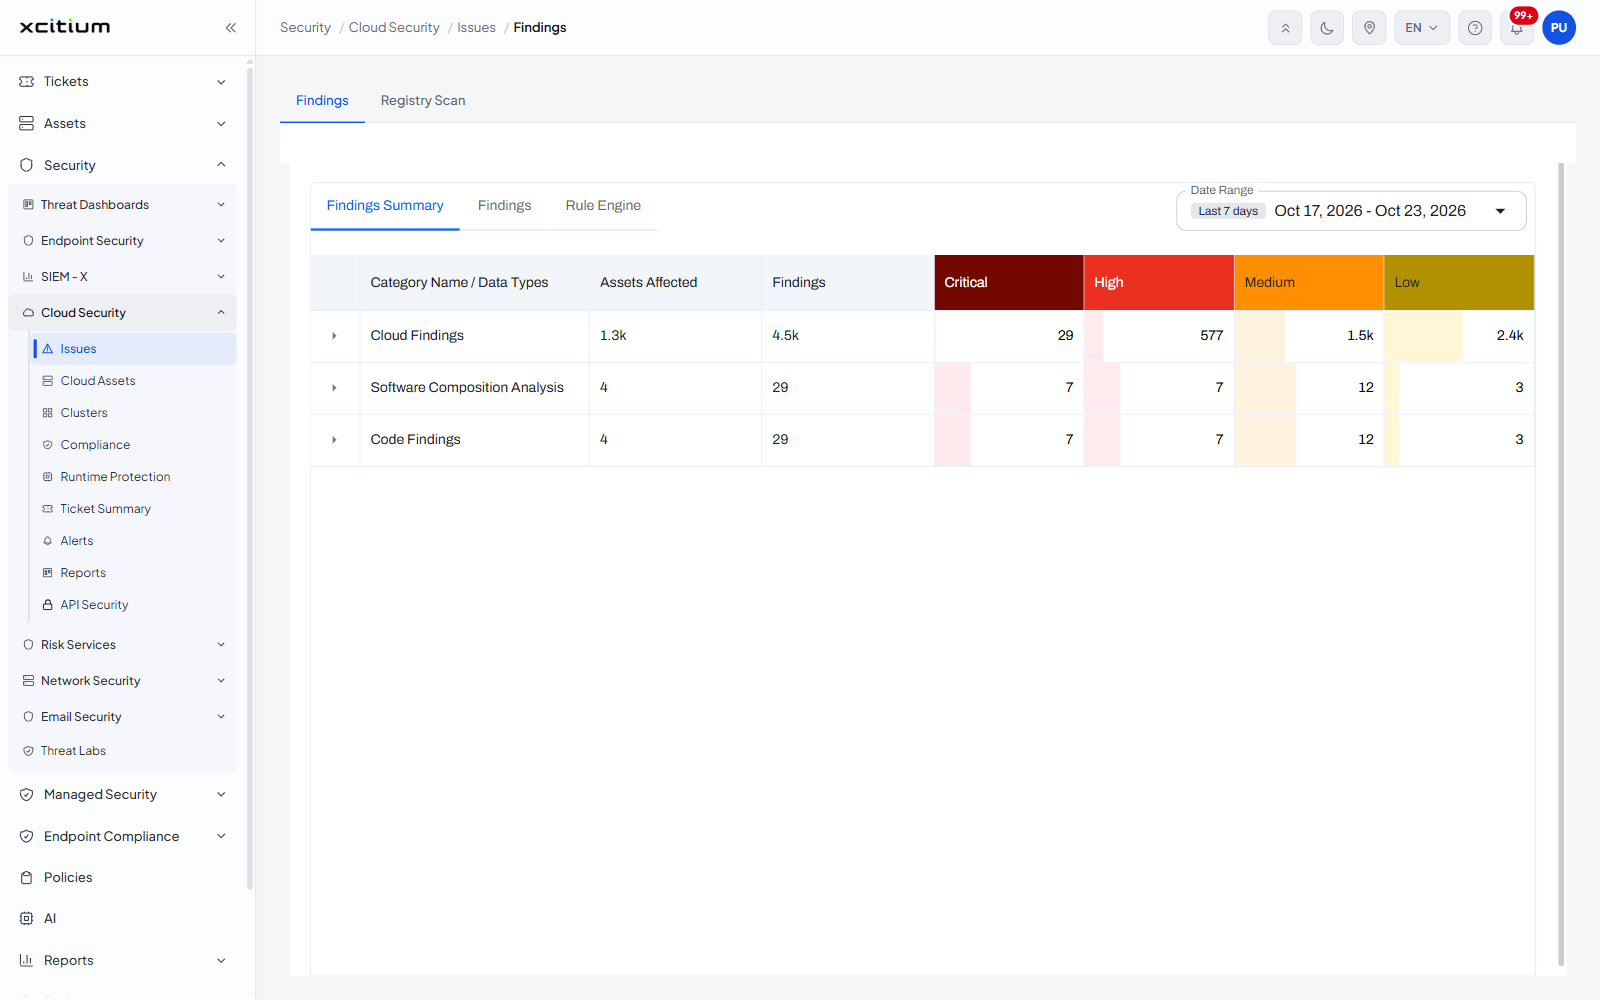
Each severity cell carries a faint bar behind the number, scaled to the value, so the worst-affected categories stand out.
Change the period
- Click the 'Date Range' control at the top right. It shows a chip naming the period and the dates it resolves to.
- Pick a preset - 'Last 5 min', 'Last 15 min', 'Last 30 min', 'Last 1 hour', 'Last 3 hours', 'Last 6 hours', 'Last 12 hours', 'Last 24 hours', 'Last 2 days', 'Last 7 days' - or use 'Custom' or 'Start & End Time' with the 'Start Date' and 'End Date' boxes and the calendar.
- Click 'Apply'. 'Cancel' leaves the period unchanged and 'Reset' puts the picker back to its starting values.
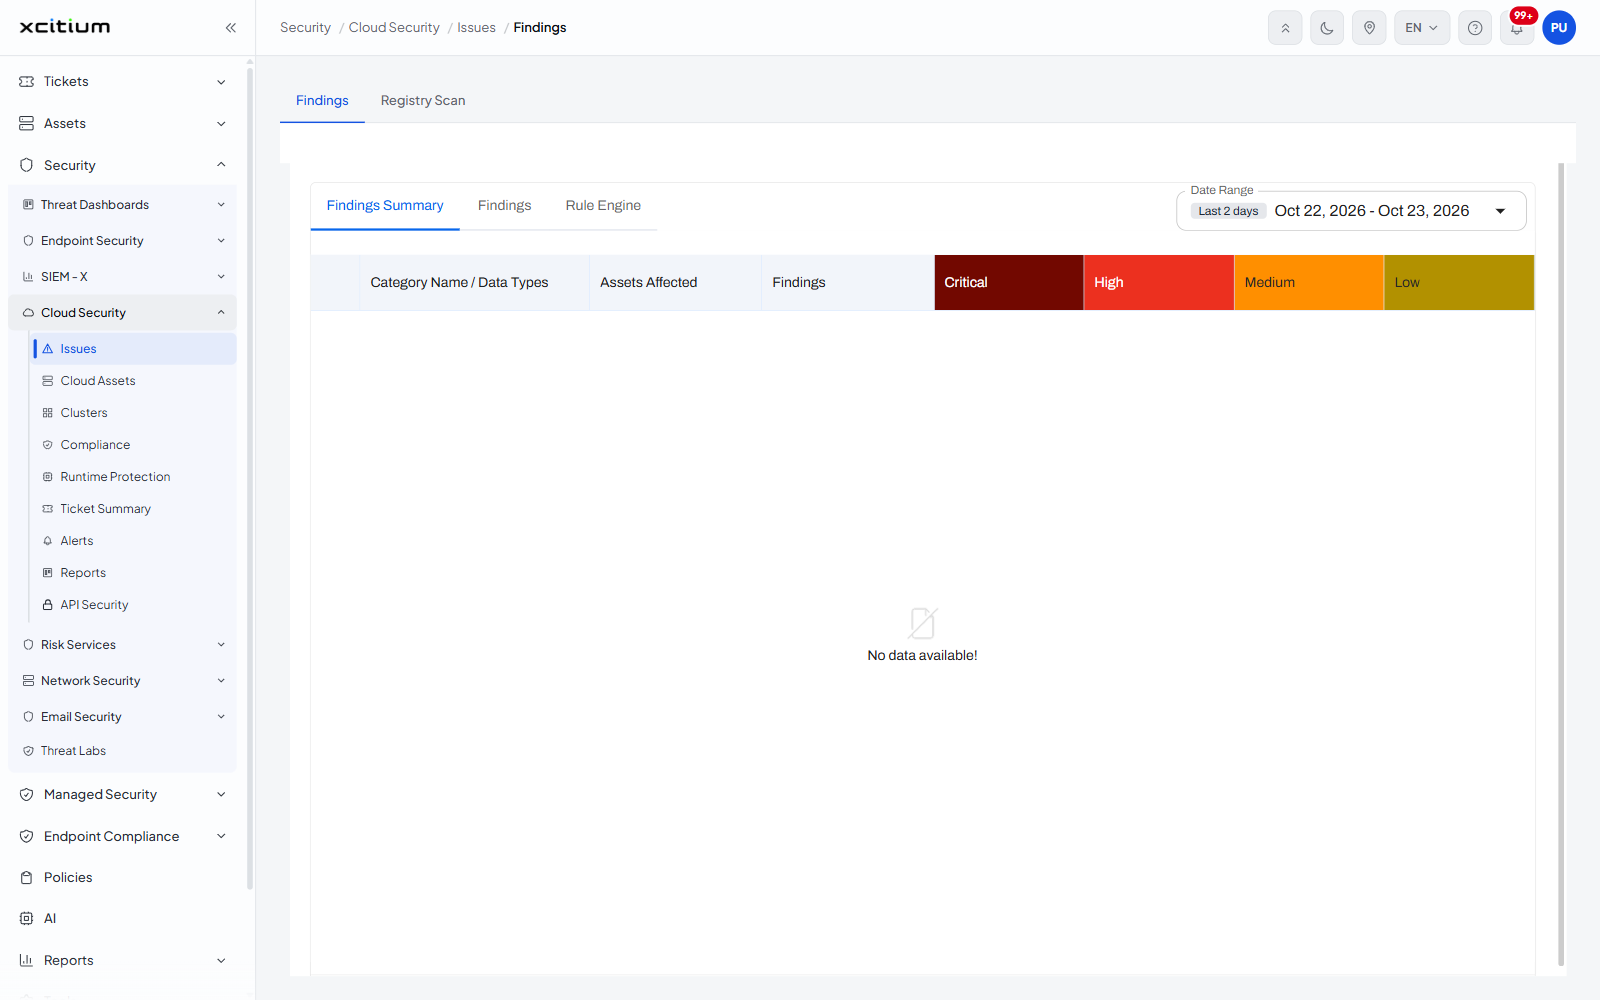
Note: the default period is 'Last 2 days', and over a short period the table often has nothing to show - it then reads 'No data available!' under the headings. Widen the period to fill it.
The categories
The categories are 'Cloud Findings', 'Software Composition Analysis' and 'Code Findings'. The categories you see depend on which scans have run.
Expand a category
- Click the chevron at the start of a category row.
- A second table opens beneath it with the same columns, one row per data type. Expanding 'Cloud Findings' showed the sources 'Cloud Scan' and 'AWS Security Hub'.
- Click the chevron again to close it.