


Collect Performance Logs
- Open a device, then click 'Collect Performance Logs' on its toolbar.
When a device is slow and the summary figures do not explain why, this dialog gathers deeper telemetry from it. The work is done in three steps, because the tools have to be installed and the problem reproduced before anything useful can be collected.
You can install the telemetry tools, check they are ready, and then collect the logs.
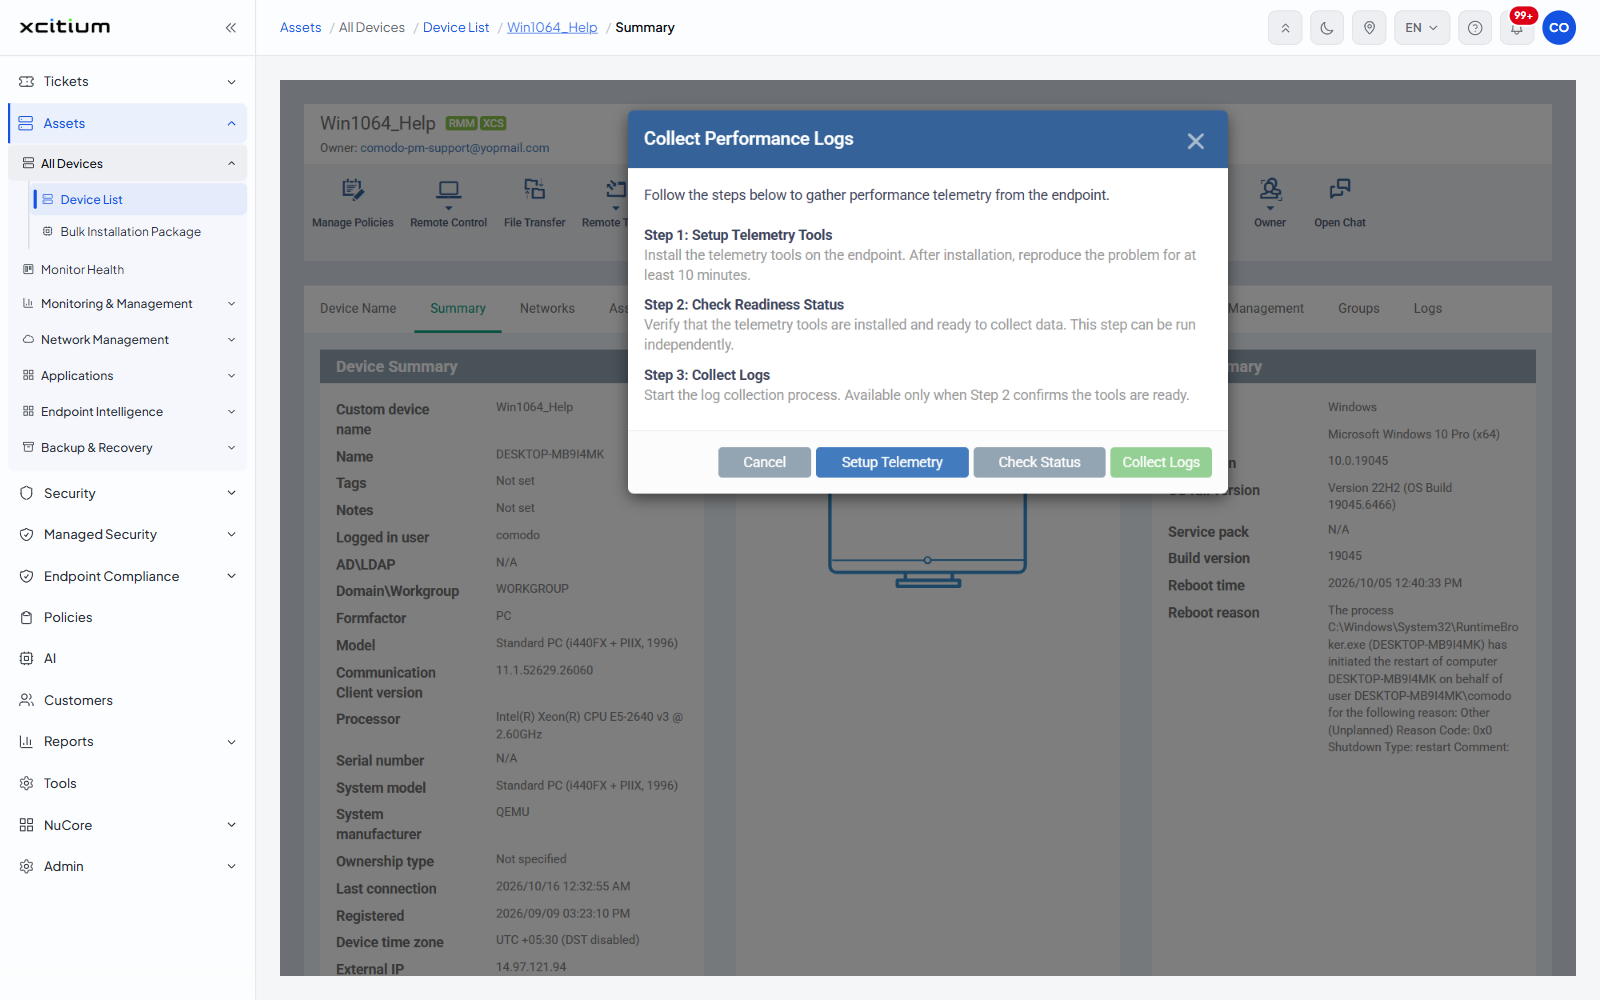
The steps
The dialog opens with the line 'Follow the steps below to gather performance telemetry from the endpoint.'
| Step | Description |
| Step 1: Setup Telemetry Tools | 'Install the telemetry tools on the endpoint. After installation, reproduce the problem for at least 10 minutes.' |
| Step 2: Check Readiness Status | 'Verify that the telemetry tools are installed and ready to collect data. This step can be run independently.' |
| Step 3: Collect Logs | 'Start the log collection process. Available only when Step 2 confirms the tools are ready.' |
The buttons
| Button | Description |
| Cancel | Closes the dialog. |
| Setup Telemetry | Carries out step 1. |
| Check Status | Carries out step 2. Greyed until the tools have been installed. |
| Collect Logs | Carries out step 3. Greyed until step 2 confirms the tools are ready. |
Collect performance logs
- Open the device and click 'Collect Performance Logs'.
- Click 'Setup Telemetry'.
- Have the user reproduce the problem on the device for at least ten minutes.
- Click 'Check Status'.
- Once the status confirms the tools are ready, click 'Collect Logs'.
Note: step 1 installs software on the device. Step 2 can be run on its own at any time to check whether the tools are already in place.