


Service Summary
- Click 'Managed Security' > 'Service Summary' to open this interface.
The 'Service Summary' page reports what the managed security service did for one customer over the last ninety days. It shows five figures as tiles and plots the alerts and incidents behind them day by day.
You can switch the page between customers and read what each figure counts from its information icon.
The page is headed 'Service Summary (Last three months)'. The customer selector sits at the top right.
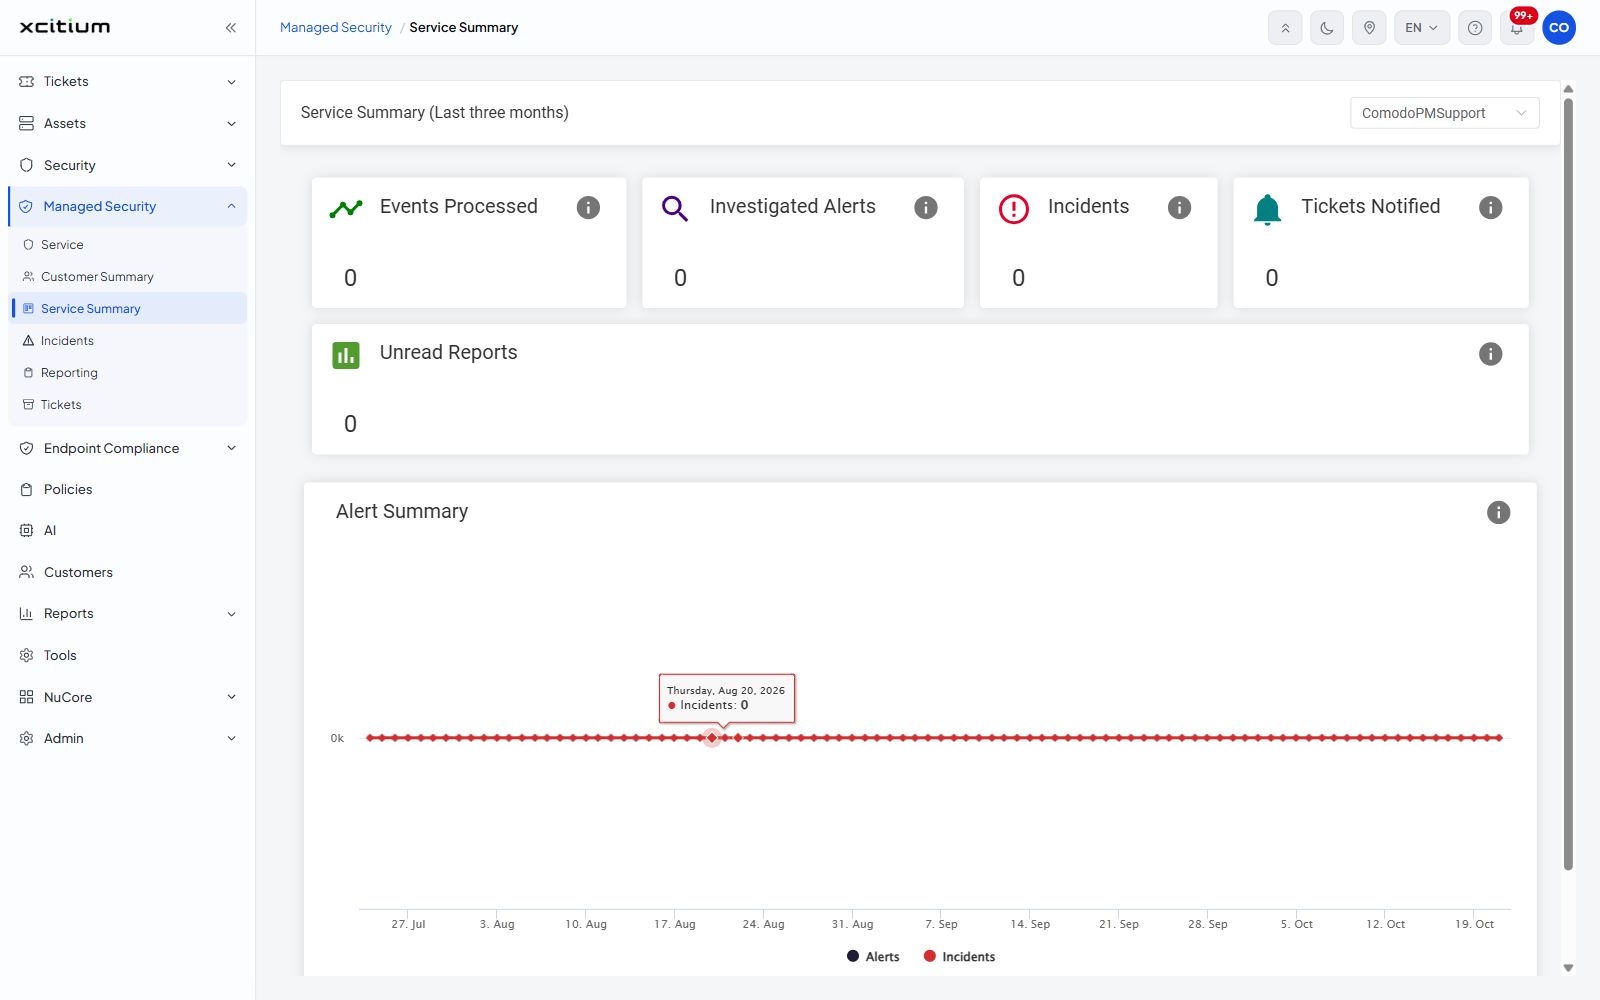
Customer selector
The selector lists every customer in your account. It does not offer an all-customers choice — this page always reports on one customer. The customer currently in view is shown in red at the top of the list.
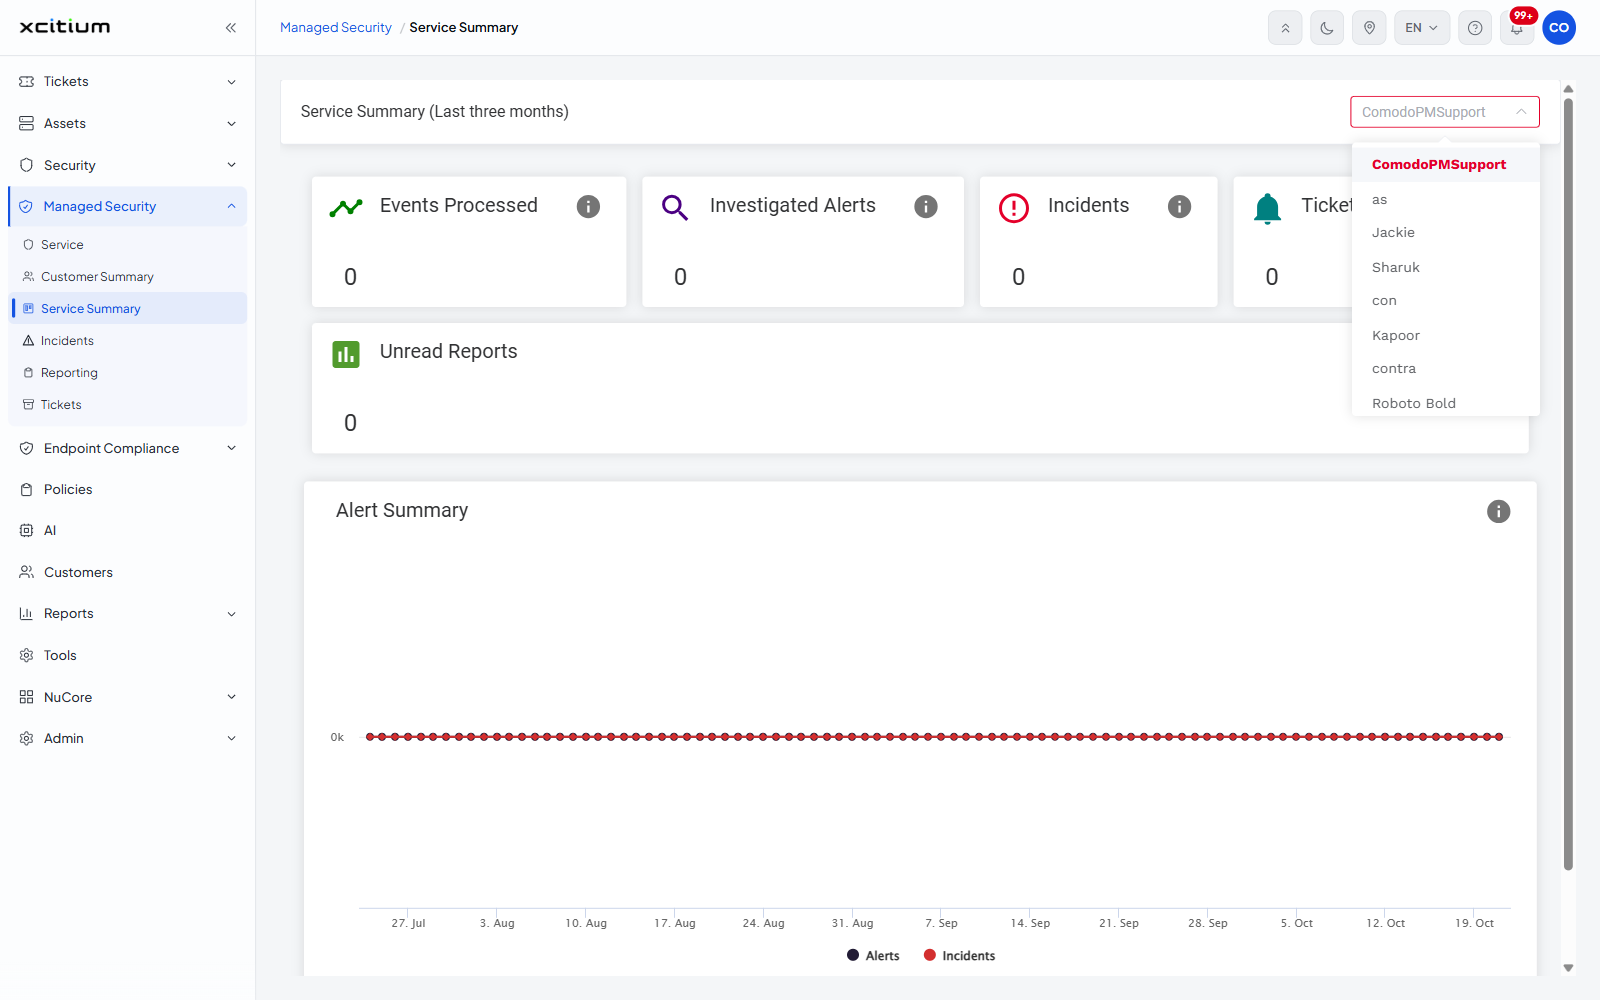
The figures
Five tiles run across the page. Each has an information icon; hover over it to read what the tile counts.
| Tile | Information icon text |
| Events Processed | 'Total amount of events processed for the last 90 days.' |
| Investigated Alerts | 'Total rule hit count of events within the last 90 days.' |
| Incidents | 'Total true incidents occurred within the last 90 days. The incident count is the total alert count minus false positives.' |
| Tickets Notified | 'Total number of incidents closed by SOC team with ’Customer Notification’ option.' |
| Unread Reports | 'Number of unread reports' |
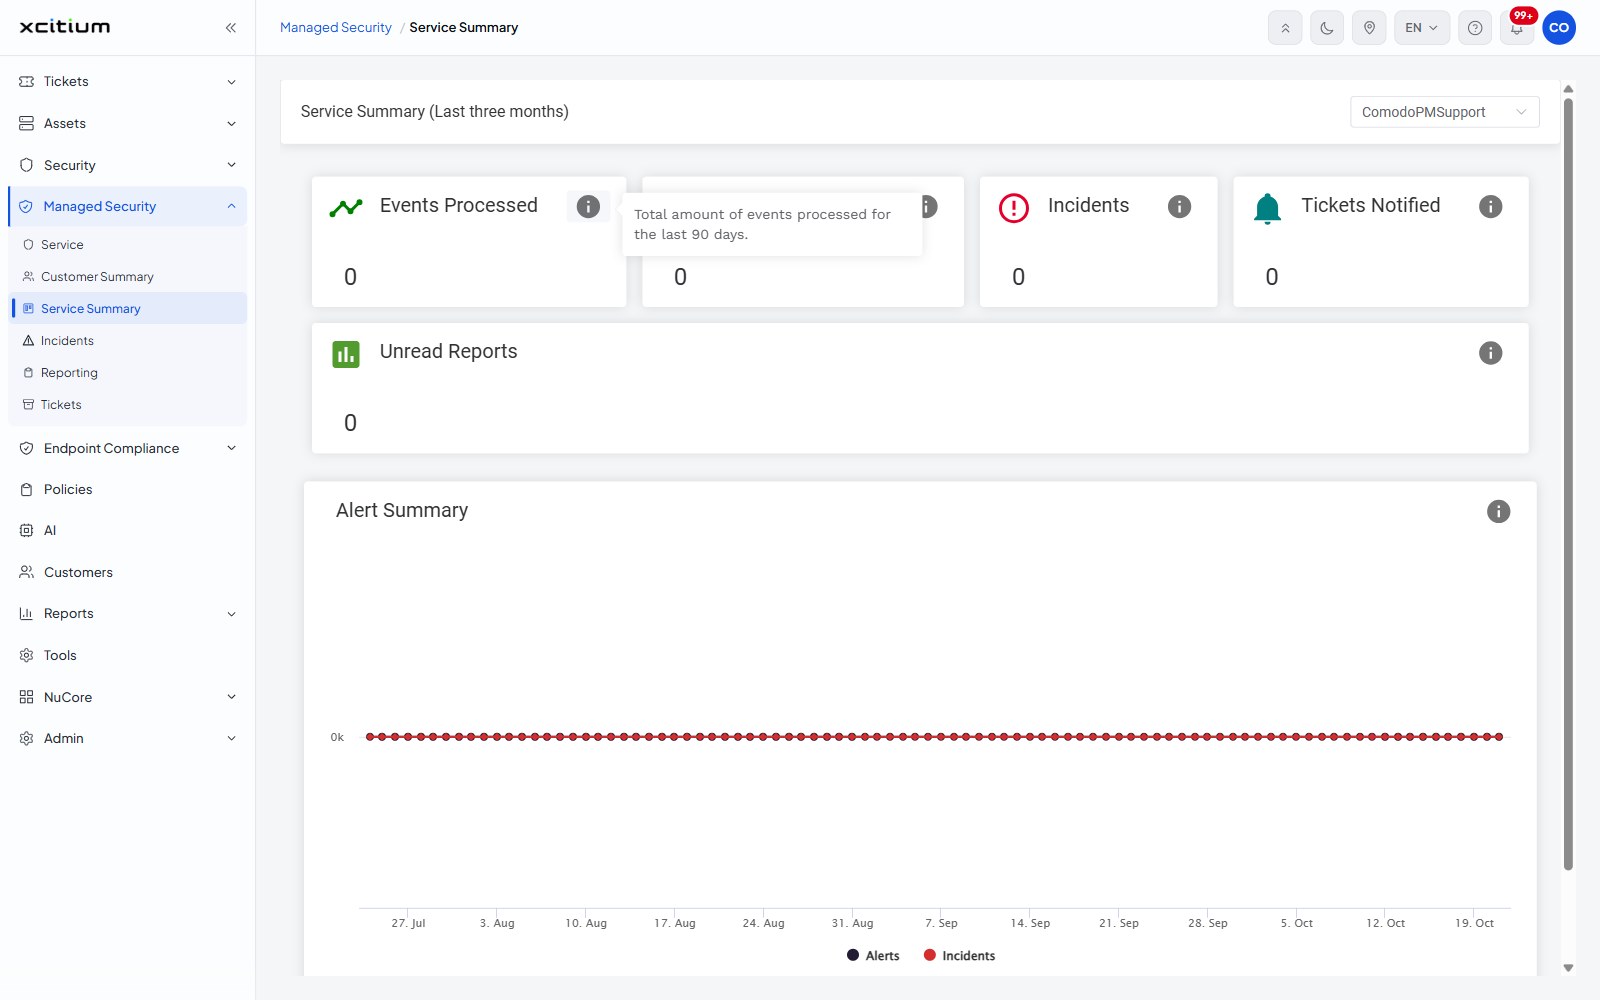
Alert Summary chart
Below the tiles, the 'Alert Summary' panel plots the same ninety days as a line chart. Its information icon reads 'Daily distribution of alerts and actual incidents.'
| Part of the chart | Description |
| Horizontal axis | The days of the reporting window, labelled weekly. |
| Vertical axis | The number of items on each day. |
| Alerts | The first series in the legend. The alerts raised on each day. |
| Incidents | The second series in the legend. The incidents raised on each day. |
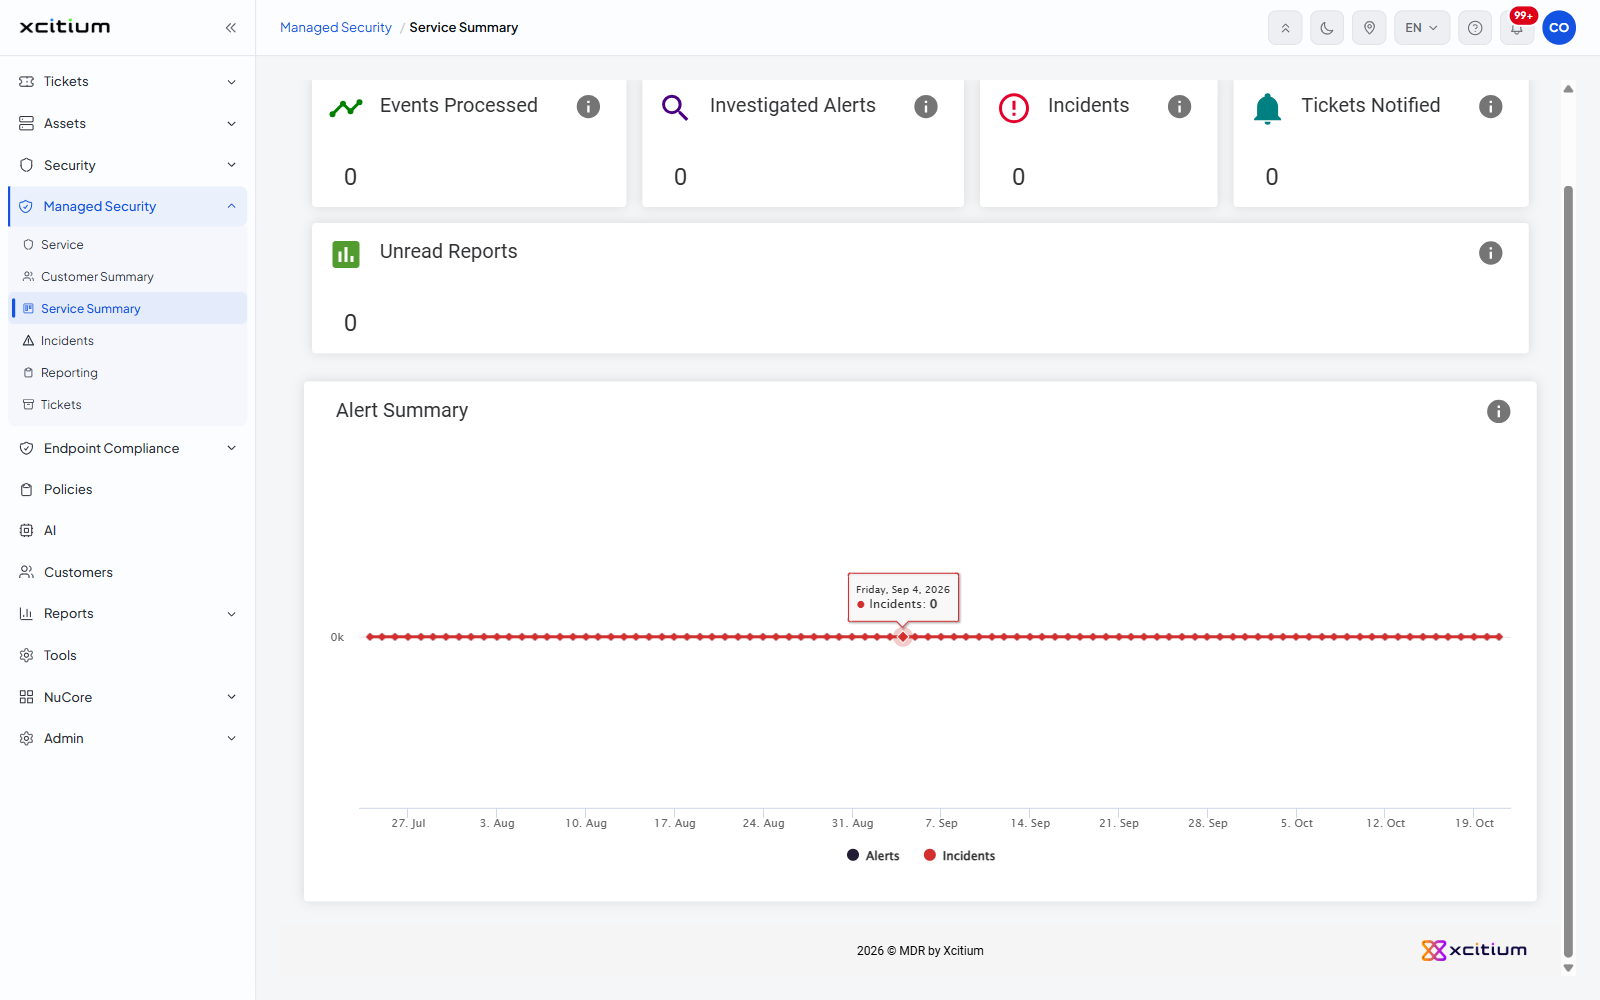
Read the service summary for a customer
- Click 'Managed Security' > 'Service Summary'.
- Click the customer selector at the top right and pick the customer you want.
- Read the five tiles for the headline figures.
- Hover over the information icon on a tile to see exactly what it counts.
- Read the 'Alert Summary' chart to see how those alerts and incidents were spread across the window.
Other ways to reach this page
- Click a customer card on 'Customer Summary'. See Customer Summary.
- Click the three-dot button on a row of the 'Customer Health' list on the 'Service' page, then click 'Service Summary'. See Customer Health.