


Customer Health
- Click 'Managed Security' > 'Service' and scroll to the bottom of the page.
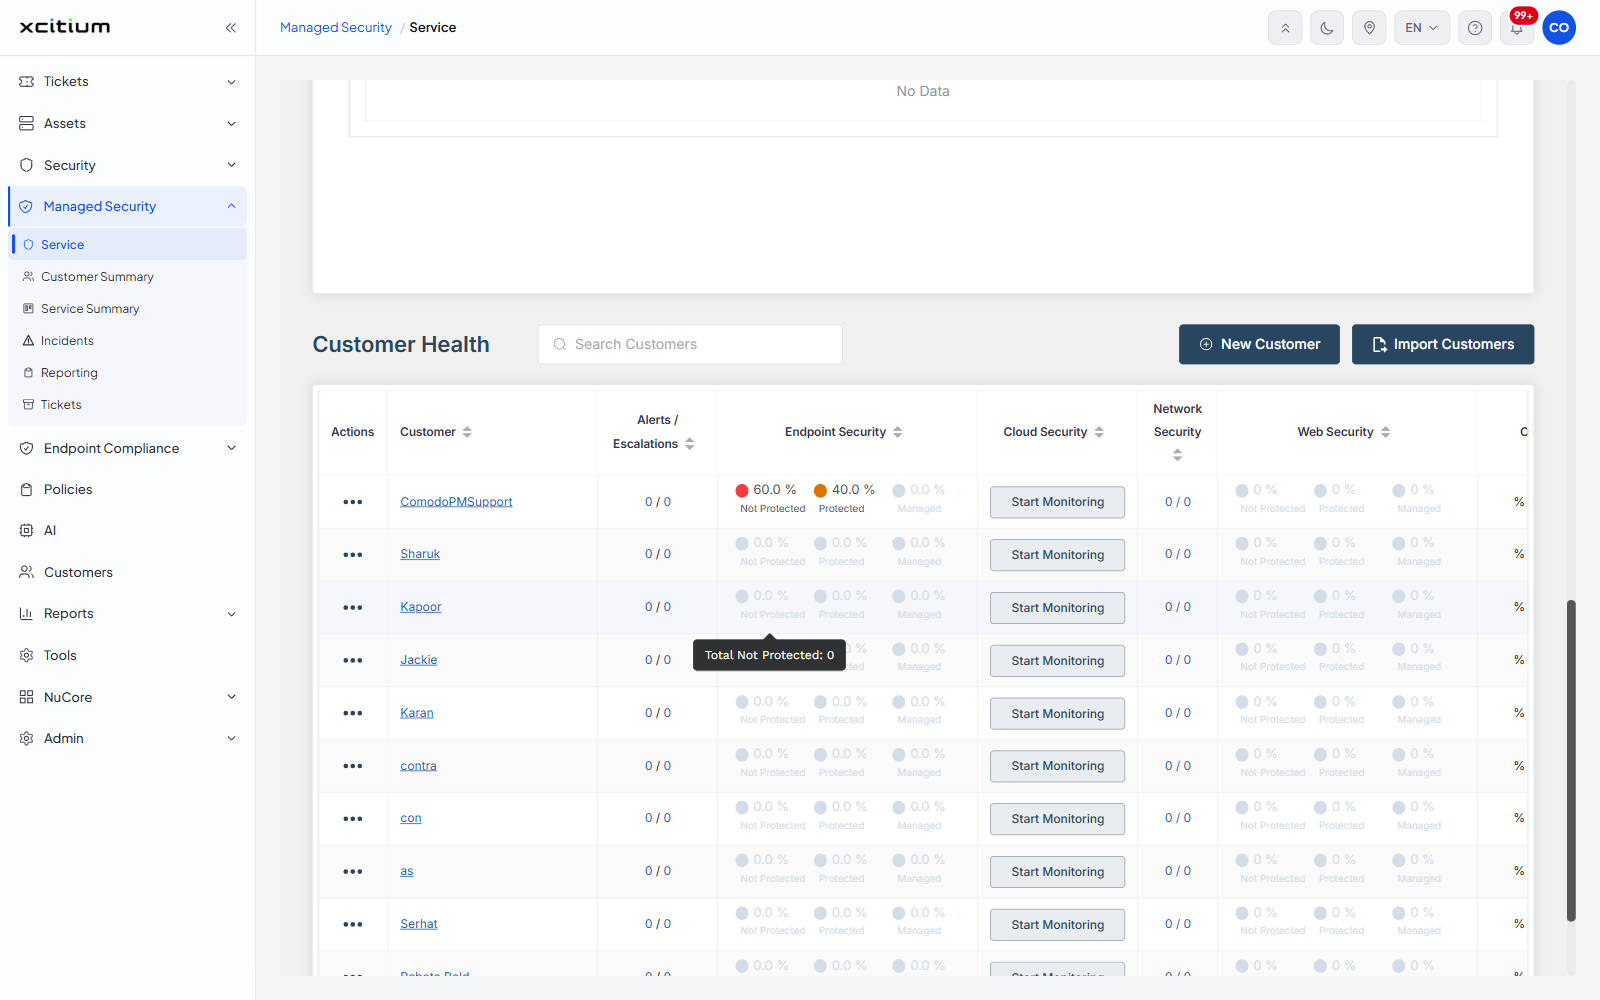
The 'Customer Health' list shows one row per customer. Each row gives the alert and escalation count for that customer, the protection split for each of the four security pillars, and how far onboarding has progressed.
You can search for a customer, sort the list by most of its columns, open a customer in any of the managed security pages, start monitoring a pillar that is not yet monitored, add a customer by hand, and import customers from another platform.
Toolbar
| Control | Description |
| Search Customers | A search box above the list. Type to filter the list by customer name. |
| New Customer | Opens the 'Add New Customer' dialog so you can add a customer by hand. See Add a New Customer. |
| Import Customers | Opens the 'Getting Started to Import Customers' dialog so you can pull customers in from another platform. See Import Customers. |
Column descriptions
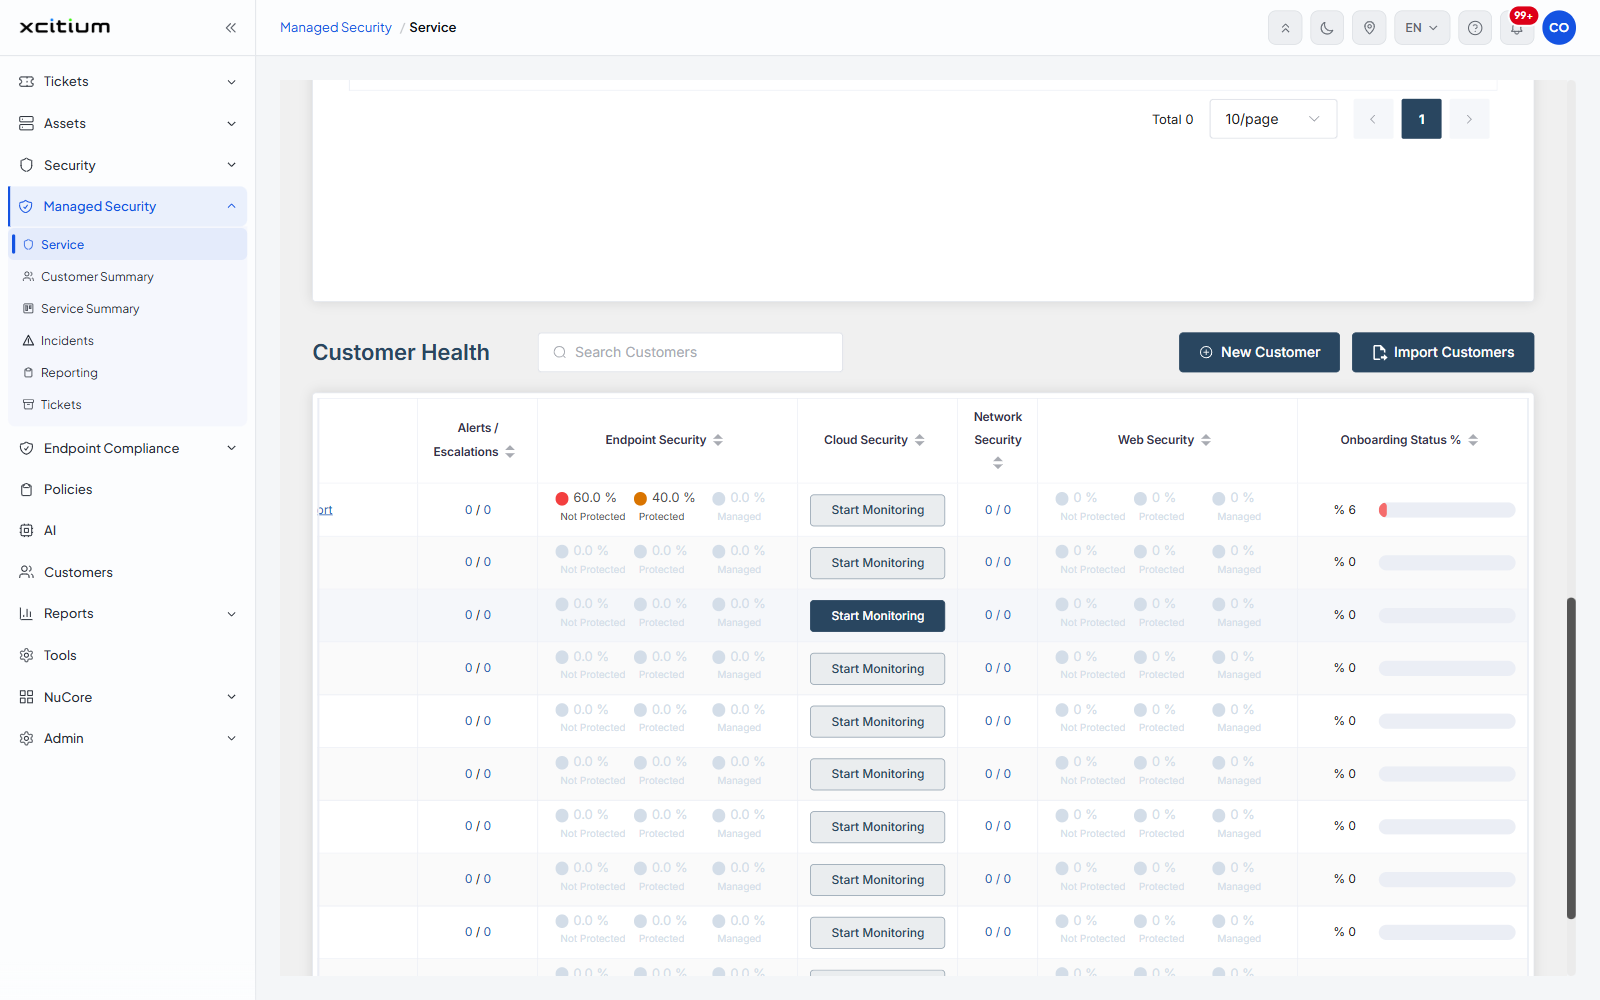
The table scrolls sideways. Scroll right to reach the last columns. Columns marked as sortable carry a sort control in the heading.
| Column | Description |
| Actions | Shows a three-dot button that opens the row menu for that customer. Not sortable. |
| Customer | The name of the customer, shown as a link. Sortable. |
| Alerts / Escalations | The number of alerts and the number of escalations raised against the customer, written as two figures separated by a slash. Sortable. |
| Endpoint Security | The endpoint protection split for the customer, as three percentages labelled 'Not Protected', 'Protected' and 'Managed'. Sortable. Hover a figure for its underlying count, for example 'Total Not Protected: 0'. |
| Cloud Security | The cloud protection figures for the customer. Where no cloud monitoring is set up the cell shows a 'Start Monitoring' button instead. Sortable. |
| Network Security | The network alert and escalation figures for the customer, written as two figures separated by a slash. Sortable. |
| Web Security | The web protection split for the customer, as three percentages labelled 'Not Protected', 'Protected' and 'Managed'. Sortable. |
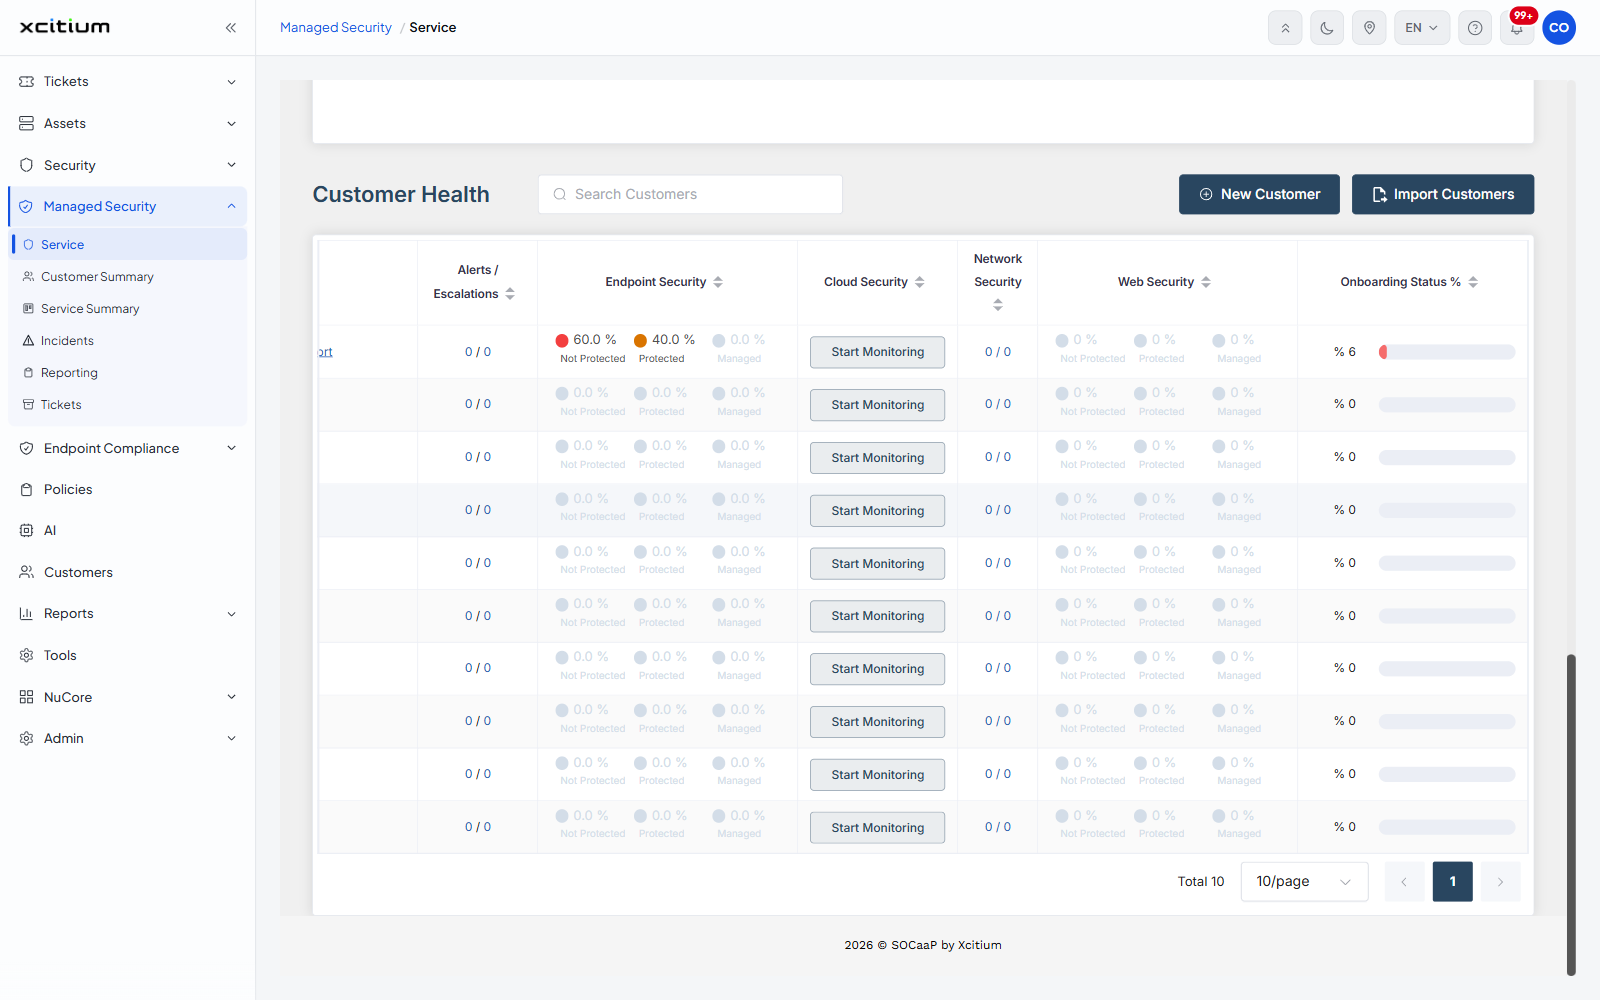
| Onboarding Status % | How far onboarding has progressed for the customer, as a percentage with a progress bar. Sortable. |
Row menu
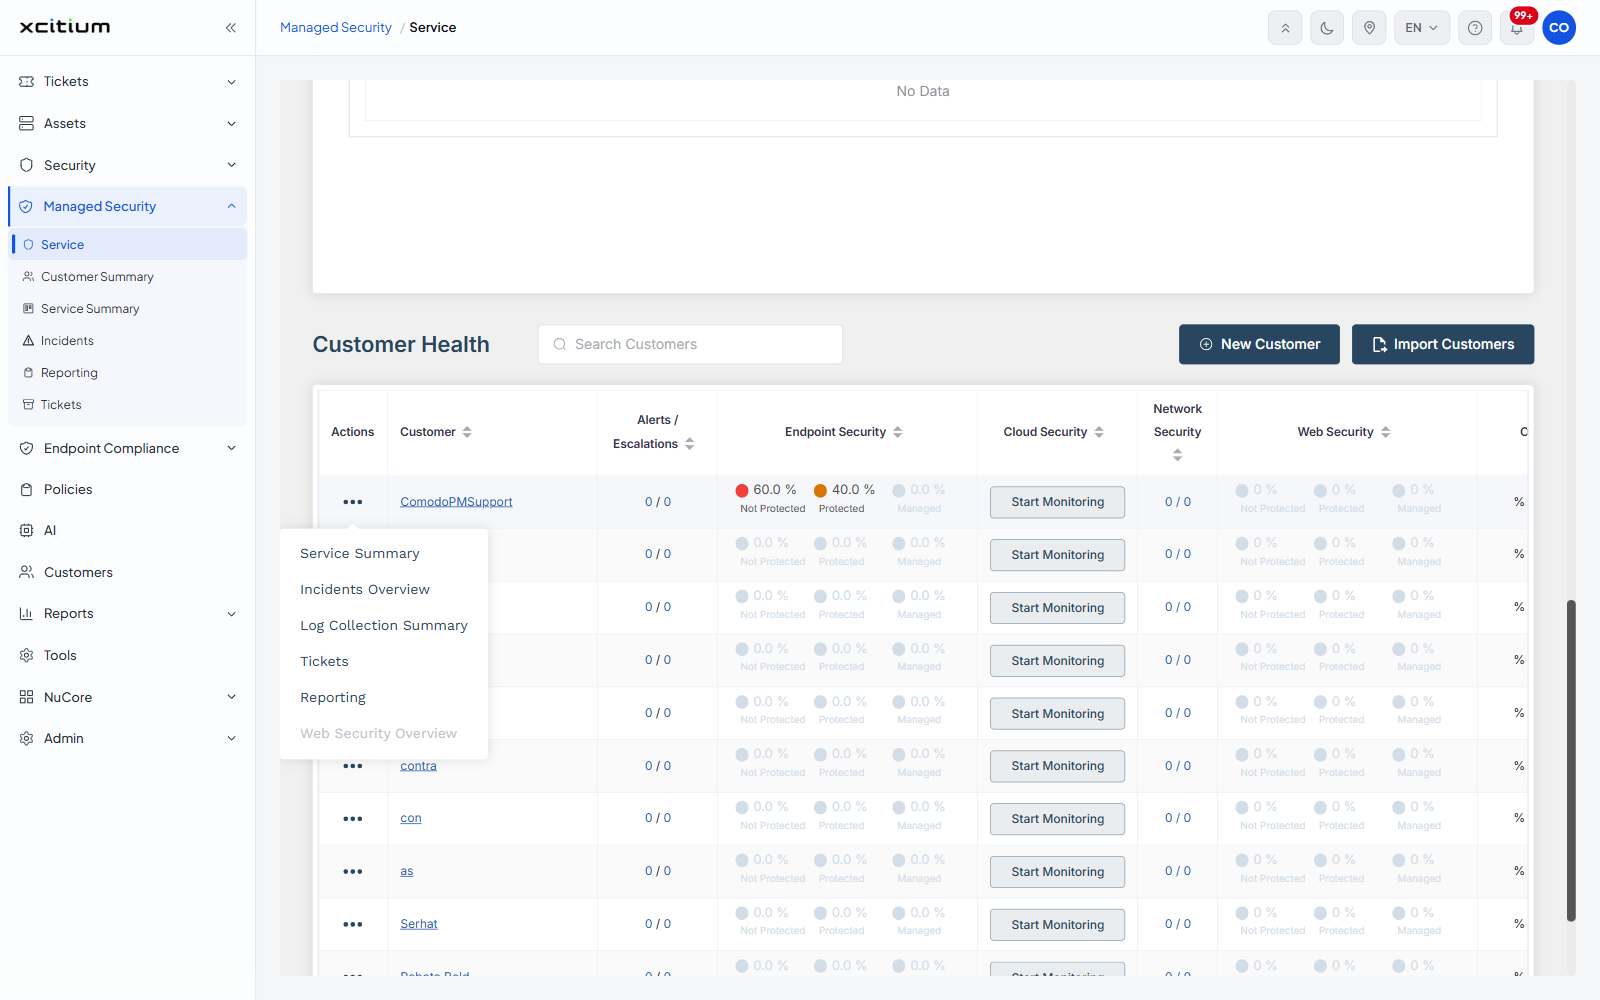
Click the three-dot button in the 'Actions' column to open the menu for that customer. The menu jumps straight to that customer in another part of the module.
| Menu item | Description |
| Service Summary | Opens the service summary for the customer. See Service Summary. |
| Incidents Overview | Opens the incidents raised for the customer. See Incidents. |
| Log Collection Summary | Opens the log collection summary for the customer. |
| Tickets | Opens the service tickets for the customer. See Tickets. |
| Reporting | Opens the reports for the customer. See Reporting. |
| Web Security Overview | Opens the web security overview for the customer. This item is greyed out when it is not available for the customer. |
Row button
| Button | Description |
| Start Monitoring | Shown in a pillar cell that has no monitoring set up for that customer. Starts monitoring that pillar for that customer. |
Find and open a customer
- Click 'Managed Security' > 'Service' and scroll to 'Customer Health'.
- Type part of the customer name in 'Search Customers' to narrow the list.
- Click a column heading to sort the list by that column.
- Click the three-dot button in the 'Actions' column of the row, then click the page you want to open for that customer.
Read a row
- Read 'Alerts / Escalations' first. It tells you whether anything is outstanding for that customer.
- Read each pillar cell. A 'Start Monitoring' button in a cell means that pillar is not being monitored for the customer yet.
- Read 'Onboarding Status %' to see how much of the onboarding is still to do.
- Hover over a percentage to see the count behind it.